How To Trade The Options Chart Instead Of The Stock Chart

July 18, 2023
I want to make this Options Chart Trading guide as quick and as simple as possible. So I am going to cut out all the fluff and basics and go straight into the steps.
But first, let’s talk about the reasons why trading the options chart makes sense in the first place.
Why Trade The Options Charts
First of all, it is a direct way to track and trade the price action of the Option Contract itself rather than focusing only on the underlying. Remember that Options are derivatives of the underlying stock but they do not always move in lockstep with the stock for various reasons.
Secondly, as you will see shortly, if you can apply some of the same technical analysis that you use on your stocks, to the actual Option contract you can often find that there is an edge there.
Finally, you get to see and treat the option contract as an asset in itself and this can be a psychological advantage simply because you are able to ignore the noise, news and narrative and just focus on what the contract is doing. It becomes a simple matter of: is the contract going up, or is it going down? Just a clear objective assessment which is what you need. Right?
How To Trade The Option Charts
Step 1: It all obviously begins with the underlying stock. You must have a reason why you want to trade the stock and a plan, method or strategy to trade it. In this case the stock I am going to use for this exercise is Lowe’s Companies (LOW).
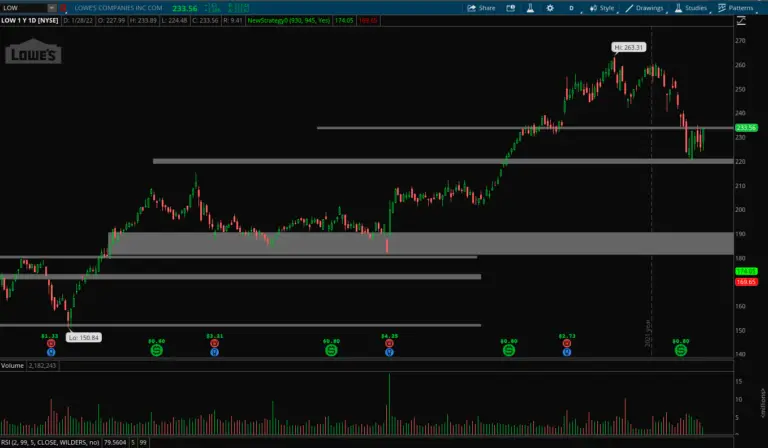
I am trading LOW because it found some support, engulfed the previous day’s action and seems set to recover from an oversold situation. Take a look:
(you can click on the images to enlarge them)
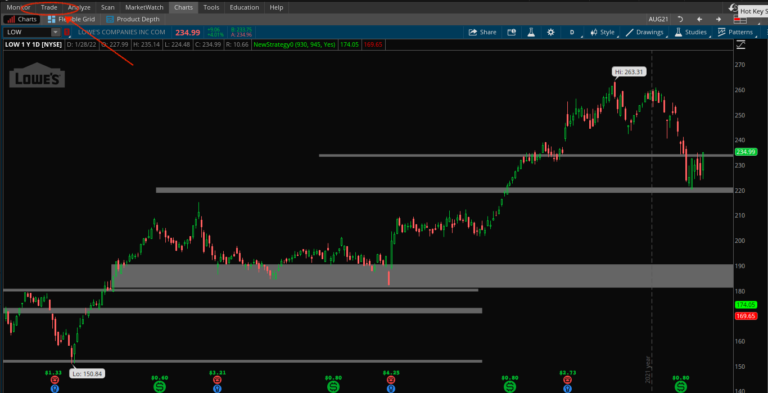
Step 2: Pull up the Option Chain: I am using Thinkorswim so pulling up the chain is very simple, you just click on the “Trade” tab in the upper left corner and voila!
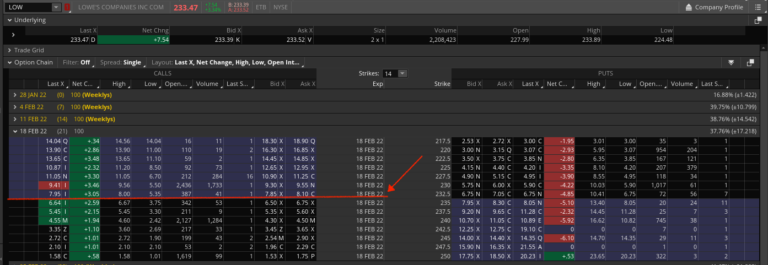
Step 3: Select the strike and expiration that you want to trade. As a rule, I like to go at least two weeks out and I try to stay as close as possible to the money. Time is by far the most important element of options trading so my preference for a minimum 14 days to expiration & staying At The Money (ATM) are all about trying to put time on my side.
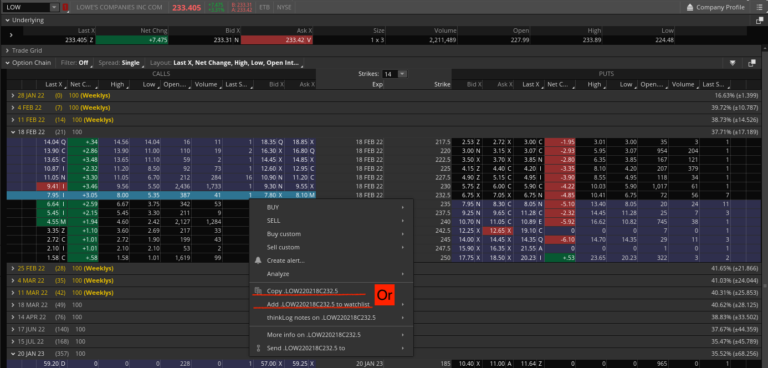
Step 4: The next thing you want to do is pull up the Options Chart. On thinkorswim, you can do that by right clicking on the contract, then on the drop down box you can choose to copy the contract and paste it in the search bar or send it to a watchlist.
I usually just send it to the watchlist of Options contracts that I am focusing on.
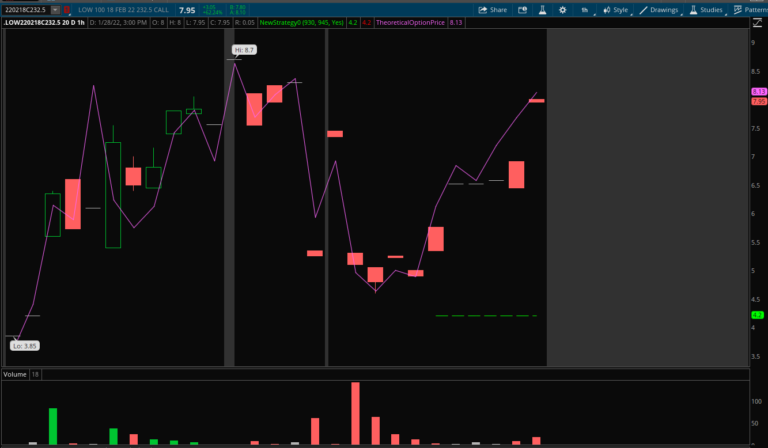
Step 5: Now at this point you want to set up your Option chart so that you can monitor the price action and get an edge. One of the problems that you will come across with pretty much all the Options charts is that they are choppy/noisy and it is hard to make out what the trend is. They typically look like this:
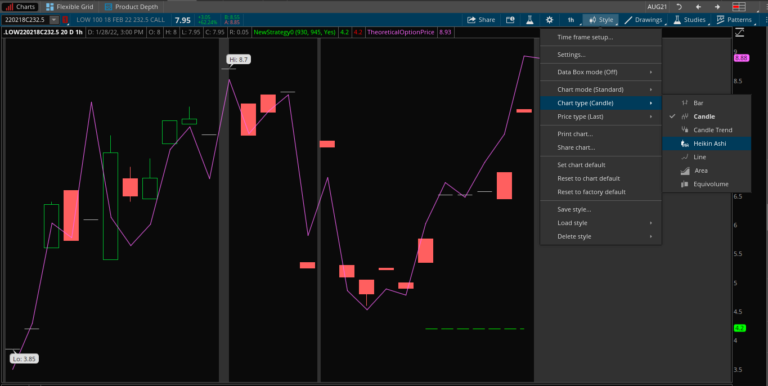
Step 6: In order to get rid of the noise/ choppiness in the chart, you want to use the Heiken Ashi bars instead of the regular candle sticks. The Heiken Ashi smooths out the price action and shows you clearly when the trend is changing. Take a look:
This is how you get to the Heiken Ashi chart:
And this is how the chart looks once the Hekien Ashi is applied. Less noise/chop.
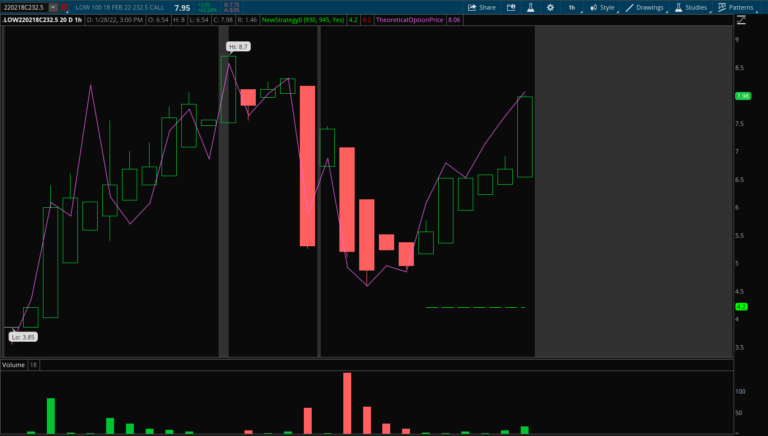
Step 7: Now that you have the basic chart up, it is now just a matter of applying your trading strategy. You need to have a set of rules for trade entry, management and exit. That is what a trading strategy is.
In this case, I am using a simple trend following strategy on the Option contract. I want to see the underlying stock giving me the Mean reversion/bounce move that I was waiting for then I want to see the Option Contract moving up.
If the contract is not ready to move, then I am not taking the trade despite how good the set up on the stock looks. If you stick to this very simple criteria, you should see some pretty good results.
Step 8: Now once I get in the trade, I need to manage it and I do this by keeping an eye on the overall trend of the underlying stock + I need to see that the contract price itself keeps making higher closes.
That’s it. It really isn’t anymore complex than that. Of course, everything in this trading business is harder than it sounds or looks. But just check it out and see how it works for you.
Comments are closed.