Day Trading Strategy
The strategy you are about to see is one that turned it all around for me. It is a simple Momentum Trading Strategy that anyone can use right now.
I have been building, testing and trading various systems for the last 18 years and this one of the best Day Trading strategies that I have come across.
I first wrote this a while ago but the concepts and steps are the exact same today as they were then. The strategy is timeless. It has been working for decades and continues to do so.
I laid it out here for you step by step. Please share it.
Step 1: Check The Big Picture
It helps a great deal when you know what is going on in the market. You will have info that tells you what environment you are operating in and how you should position yourself in the market.
Can you make profitable trades without having a clue about the bigger trends? Absolutely. But you are unlikely to make these profitable trades consistently and that is what this is ultimately about: Consistency.
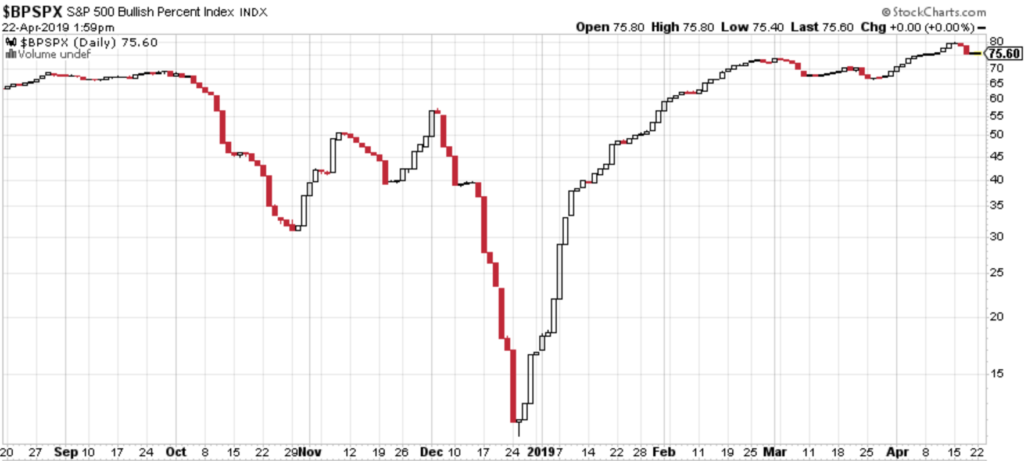
The quickest and most effective way to find out what’s happening with the big picture is to use the S&P 500 Bullish Percent Index ($BPSPX).
As the name suggests, this is an index that tracks the S&P500 and lets us know what % of the 500 stocks in the S&P are in an uptrend. The more stocks that are in an uptrend, the higher the % and therefore, the stronger the overall market. Makes sense?
The $BPSPX is what is known as a breadth indicator. It literally allows us to look under the hood of the market so to speak. You get to see the true state of the market when you can see how many stocks are in an uptrend vs down trend. This is very helpful because sometimes the major indices might be up but the number of stocks in an uptrend is way below the normal threshold or vice versa.
You can find the S&P500 Bullish % Index by going to www.stockcharts.com and typing in the full ticker symbol “$BPSPX”. If the index is above 55% then it means the Bulls are in control and the market is in an overall uptrend. On the other hand, if the index is below 55% then the market is in an overall downtrend and the bears are in control.
You will rarely find yourself guessing about the broad market trends when using this tool because it doesn’t send mixed signals. Its either above 55% or below 55%. No noise or opinions ( like the CNBC pundits) . Just a strong clear signal.
So when I pull up the $BPSPX I am looking to answer one simple question: Who is in control? If the bulls are in control, then I am looking for stocks to buy/go long. If the bears are in control, then I am looking for stocks to go short. By doing this, you will never find yourself trading against the overall trend of the market. You will always have the wind at your back and this makes for easier, more profitable trades.
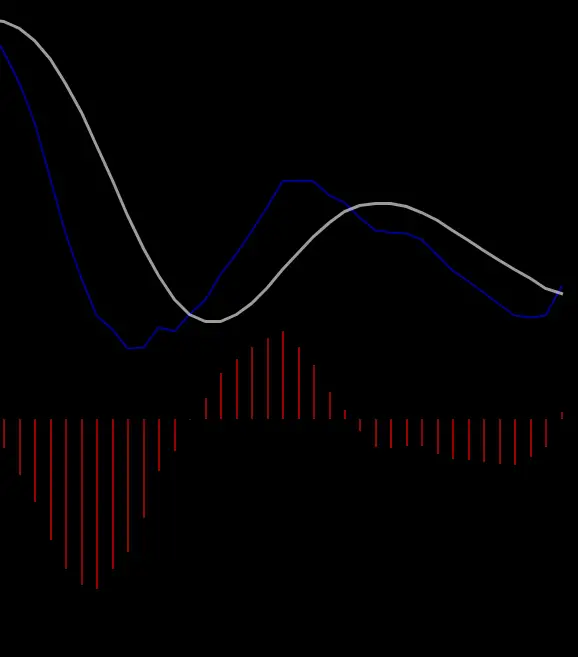
You do not need a subscription to look at this index on StockCharts.com but when it loads it will have some indicators on it. Nothing major, just a few Moving Averages, The MACD and the RSI.
Just scroll to the bottom of the page and remove these indicators by clicking the dropdown box and selecting “none” and then click “Update”. You want to remove all the indicators so you can clearly see the price action.
That is all that you need because it is all that matters. And remember: Above 55% Bullish & Below 55% Bearish.
Step 2: Find Your Trades
So now that you know what’s going on and you can clearly see who is in control, you can make up your mind what direction you want to trade in. And remember, it is always best to trade with the wind at your back. So if the bulls are in control, you want to go long. Simple.
The quick and easy way to find your trades is to look for the strongest stocks in the strongest sectors. As simple as this sounds many traders do not do this. There is no need to spend big money on scanning/screening software or pricey newsletters. This is all you need to do to put yourself in the best possible position to make money.
It works because , by focusing on the strongest sectors in the market and then focusing on the strongest stocks, inside those sectors, you are zeroing in on where the momentum is right now. It also works because:
- By doing this, you are focusing on the stocks that all the Institutions and big players are actively marking up.
- It will allow you to cut your work in half as you won’t have to spend a lot of time scanning the entire market looking for stocks to trade.
- It basically allows you to get on that big money wave and ride it to profitability. Very simple & very effective.
But don’t just take my word for it, go test it out for yourself. I want you to see for yourself that this works. So here is how you do it:
(1) First you find a sector tracker. Most trading software and platforms will have a sector tracker and there are quite a few really good free ones like Finviz, StockCharts, BarChart, Stock Mapper etc. I personally like to use the SPDR Sector Tracker because it splits up the market into 11 ETF’s that make it very simple to see which sectors are leading and lagging.
(2) When you get to the SPDR Sector Tracker website, be sure to select the “Sector Overview”. You will also notice that there is a tracker for the S&P500 Index right at the top of the page but you should ignore that and just focus on the sector ETFs. It is best to check the sectors on a desktop as it will make it easier to navigate the table and get the info you need.
(3) Once you get to the sectors, you just want to click on the 1 Day interval so you can see what sector has been leading for that day. You will have to do this about 10 minutes after the market opens so you can catch the moves early. We are focusing on 1 Day because this method is for short term/intraday trading. We are looking for some quick moves.
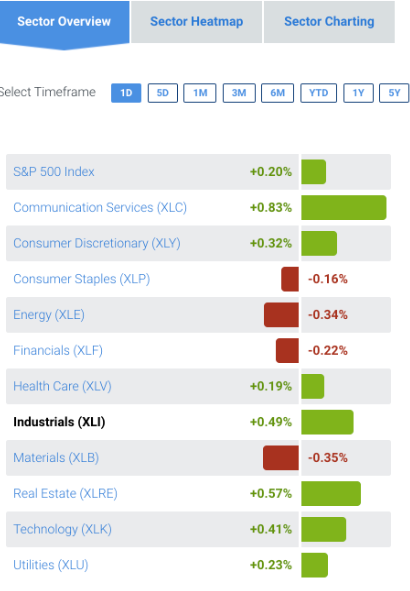
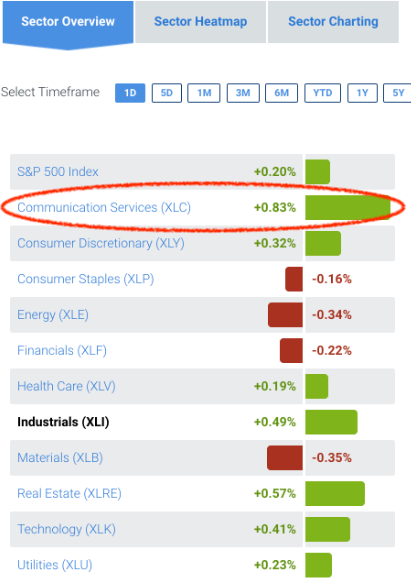
Next you have to click on the leading sector. In this example we can see that Communication Services is the leading sector . So we click on that because we are focused on the leading sector.
Once you click on the sector, you will see that there are a number of high performing stocks on this list but it is best to just focus on the top 5 stocks. It can get a bit overwhelming to start looking at all the stocks on the list . So just keep it simple and focus on the top 5 because that is where the big money is going right now.
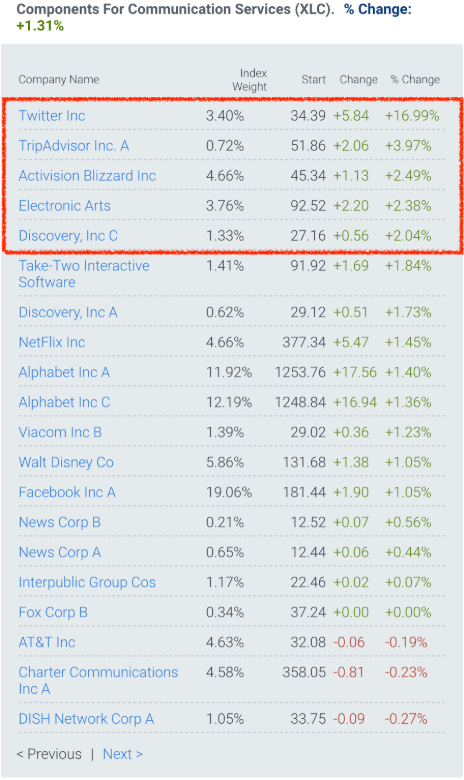
And that’s it. Those are the stocks that are moving right now and, based on statistics, will continue to move for a next 1-2 trading days and that is really all you need for a quick short term trade. Just don’t get greedy and overtrade.
As i said, it is very simple and straightforward. Now you have info that puts you right where the real momentum is and, having this info puts you ahead of 90% of traders. Simple.
Step 3: Executing Your Trade
Now that you know the trades you are targeting, it is time to set them up and execute them. The best way to execute these Day trades is to use the 15 Minute Opening Range Breakout (ORB) method. I am going to use Tripadvisor (TRIP) from the list to show you the steps. But first let me say that we use the 15 minute time frame because:
1. The tone of the day is usually set in the first 15 minutes after all players take action on whatever info they gathered overnight.
2. It is not as fast as the 1 minute, 5 minute or 10 minute so it is less likely to give false signals.
3. The ranges are well defined and in most cases the high or low for the entire trading session is made in the first 15 minutes of the day.
So here is how its done:
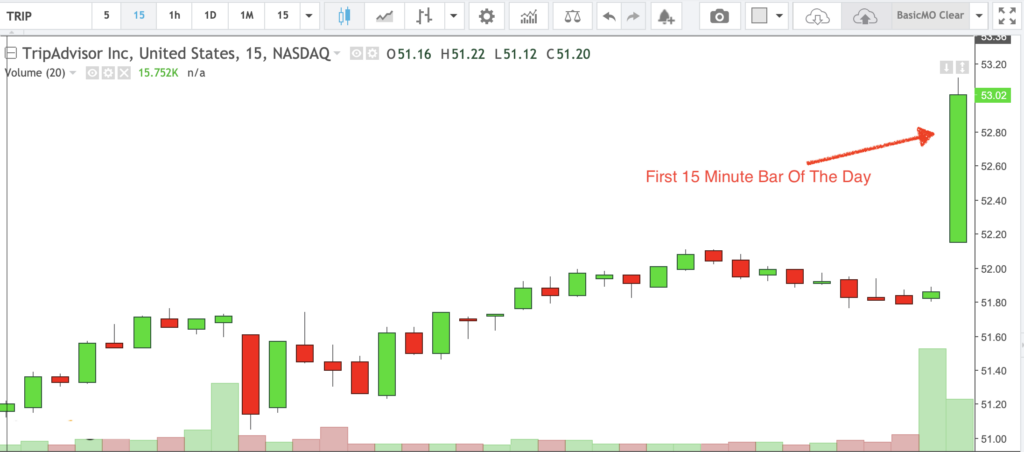
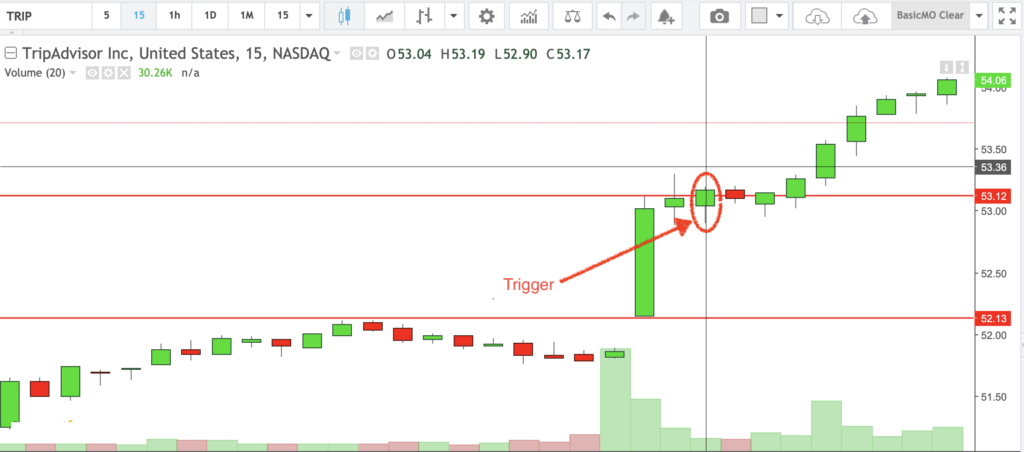
After you pick the trade you want to take ( we are using TRIP in this example) you simply pull up a 15 minute chart and wait for the first 15 minutes to pass.
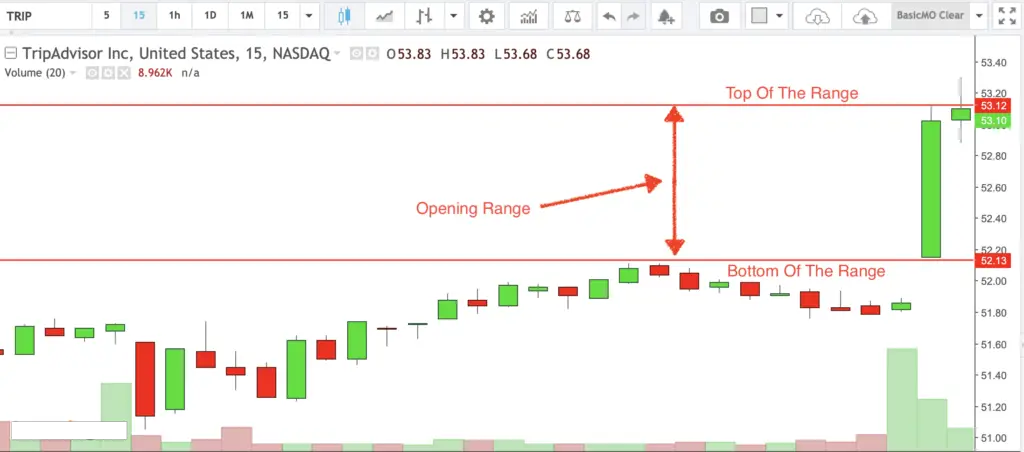
After the first 15 minutes passes, you will have to go ahead and clearly mark the top and bottom of that first 15 minute bar so you can clearly see the opening range.
The next thing you have to do, is to wait for the first 15 minute bar that closes above the top of the range. This is what will trigger you into the trade. It works extremely well as a trigger because once the range breaks it signals that the momentum is going in that direction.
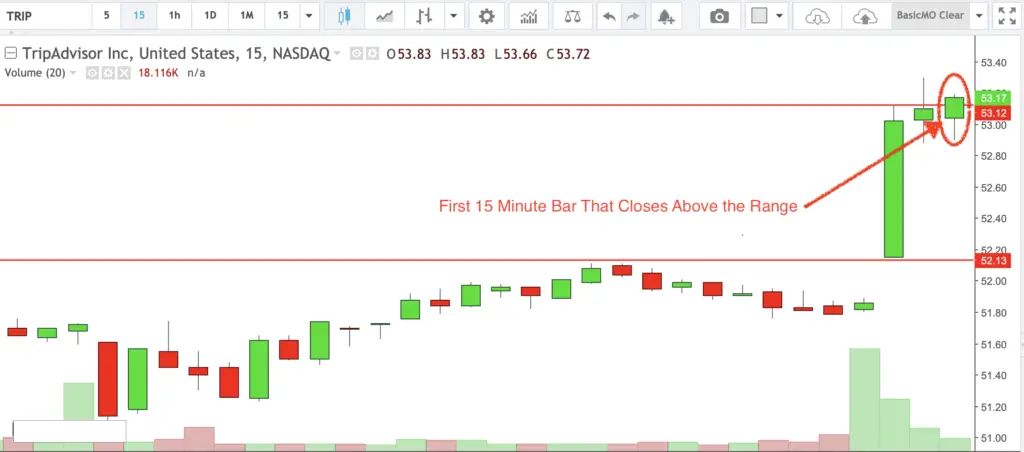
Once you get into the trade, the idea here is to hold your position until the end of the trading session to take full advantage of the upside momentum. And this is how TRIP was playing out half way into the trading session after it triggered:
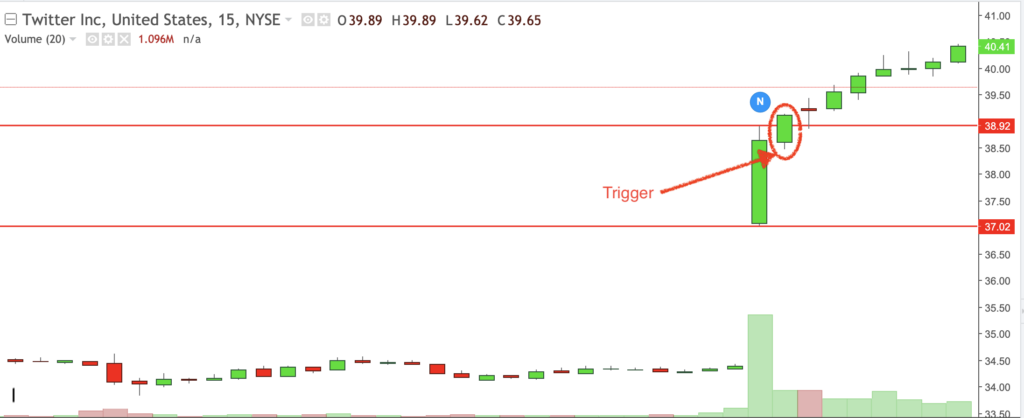
We can take a look at a few other stocks on the list to see how they played out. I should also point out that these screenshots were taken at around mid- day when there was a full 4 hours left in the trading session. So what you are seeing is not the full extent of the daily move. There was a lot more to come. Let’s take a look at Twitter (TWTR)
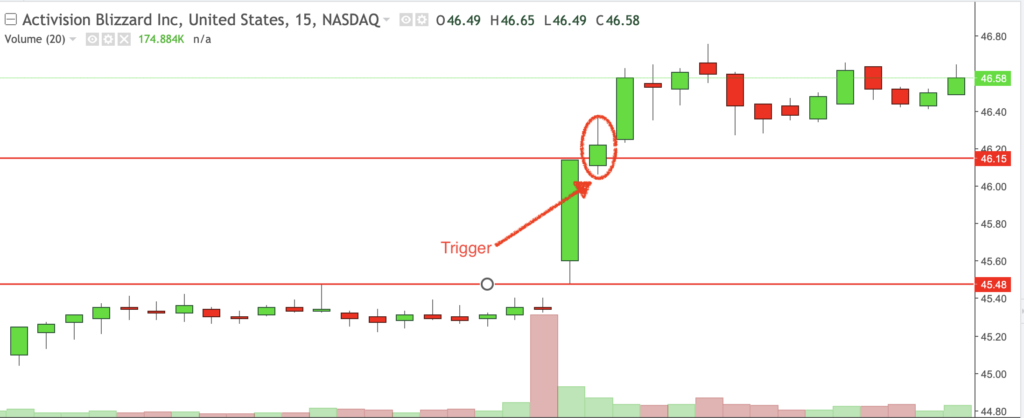
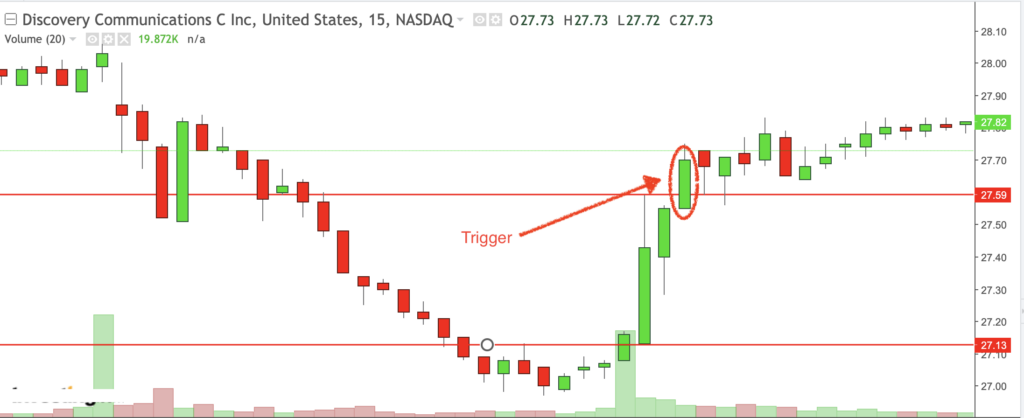
Now let’s look at Activision Blizzard (ATVI) & Discovery Communications (DISCK)
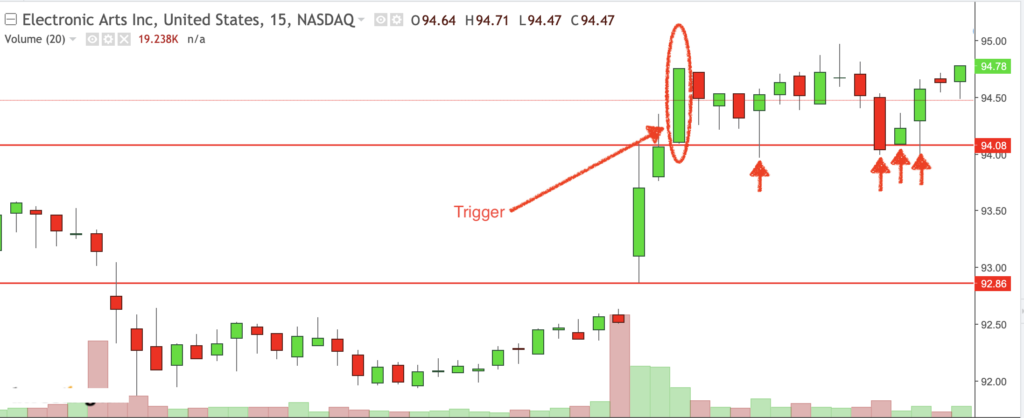
And the last of the 5 leading stocks in the leading sector was Electronic Arts (EA). I really love this example because it shows you just how powerful the 15 Minute Opening Range is. Just look at the four small arrows on the chart.
These arrows mark the 4 times the top of the range was tested after it triggered. It shows clearly that once the price gets above the range, the range now acts as support. I could show you a thousand charts just like this to prove the point.
Step 4: Set Your Stops/Manage Risk
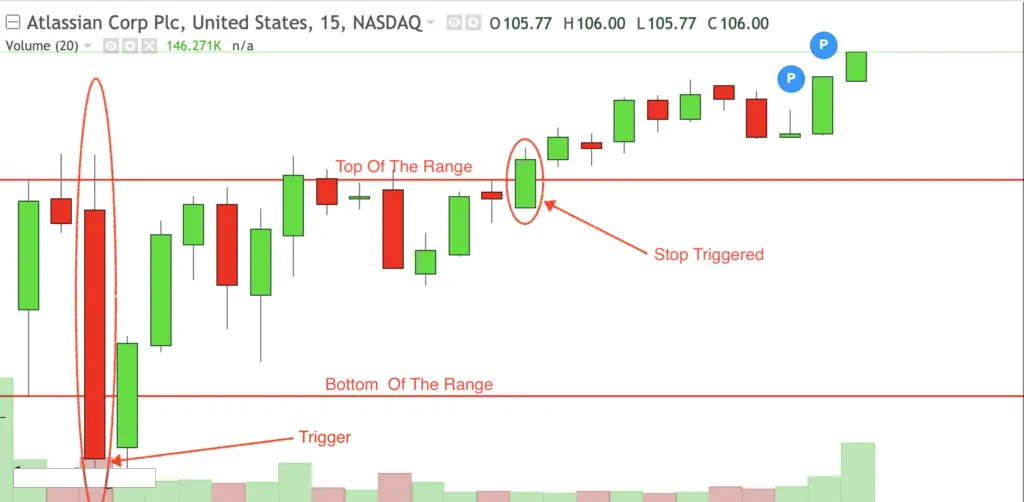
Once you take a trade using this method, you should set your stops at the bottom of the opening range. So if the stock triggers and then, for some reason, reverses and a full 15 minute bar closes below the range then you will get stopped out. This is what a stop out looks like using Colgate Palmolive (CL) as an example in a recent session:
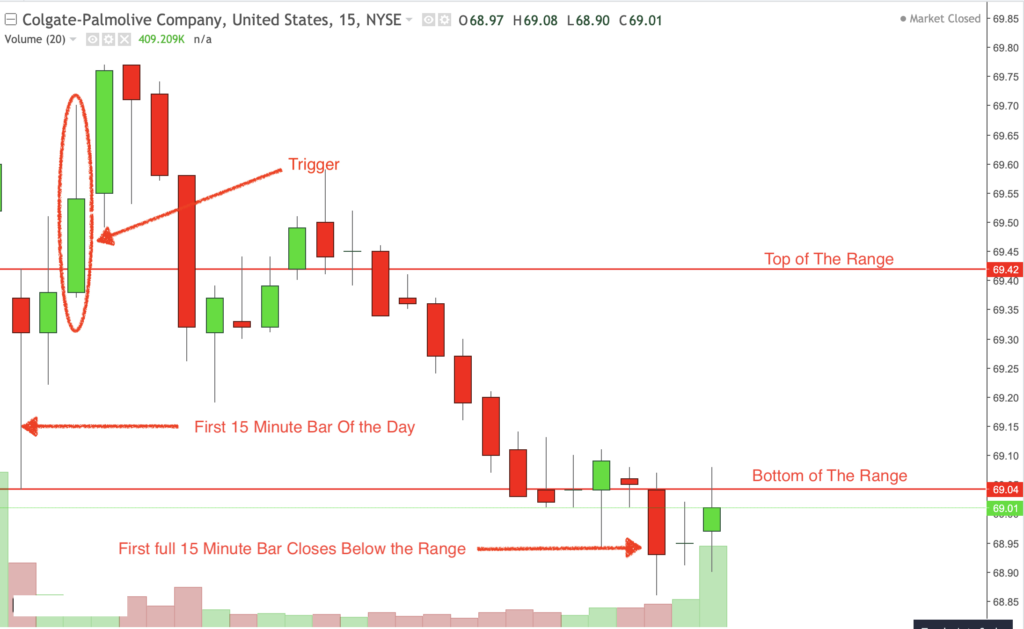
This is a very simple and objective way to set a stop. Once a full 15 minute bar closes below the range, then you are out of the trade. This is very effective because:
- It eliminates the need for guessing and subjective levels
- We know the 15 minute Opening Range tends to set the tone for the day, so once the range is broken, it tells you clearly that there is a trend reversal.
- And it allows you to easily quantify your risk. The price difference between where the trade triggers and where you set your stop, at the bottom of the range, is your defined risk.
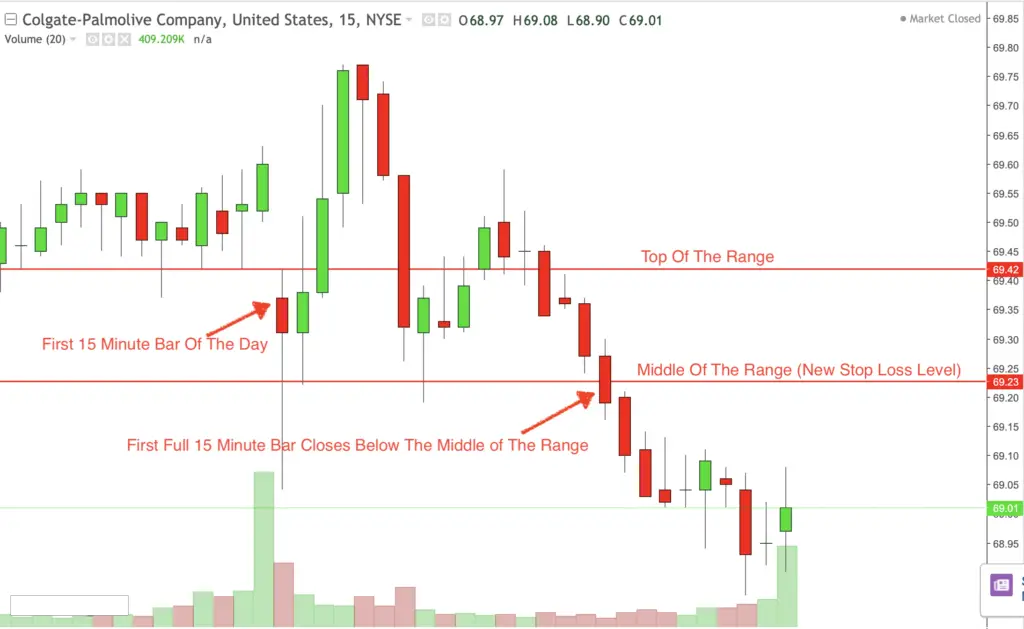
Another great advantage to using this strategy is that you can adjust your risk as needed. For instance if you felt that the price difference between the bottom of the range ( the default stop loss level) and the trigger price was too wide, you could simply adjust it and move the stop to the mid point or to any level that suits your risk.
I know you may not be able to see it clearly so let me point out the In the CL example above, the trigger price is 69.64 and the Stop loss level, by default, is the bottom of the range which is 69.04. So the risk on the trade is only .60 cents ( 69.64-69.04) or (trigger price-bottom of the range).
Generally speaking, .60 cents is not a lot of risk for a normal account size but let’s say it was…. Let’s say you felt that .60 cents was too much risk for you. Then all I am saying is that you can adjust the stop.
In this instance we will move it to the midpoint. So, as soon as the trade triggers and you get in, you can move your stop to the middle of the range and cut your risk in half. From .60 cents to .30 cents like this:
Step 5: Set Your Profit Targets
Now that I have taken care of the downside let me show you how to set your targets and take your profits. I deliberately dealt with the Stops/risk Management first because that is exactly how you should approach your trades. It should always be risk first.
You know that old trading maxim that says “ if you take care of the downside the upside will take care of itself”? Well it’s true. I can attest to that. Anyway, let’s move on. This is how you set targets:
Method: 1 Close At The End Of The Session
Just close the trade at the end of the session. That is the default profit taking/trade exit method when using this strategy. And it works well when the stock is in a very strong uptrend and it closes at or near its highs. But that doesn’t always happen.
In fact, what you are more likely to see is profit taking by Day Traders heading into the market close so the stock sells off. So, as I said, the stock would have to be in a really strong uptrend to use this method.
Method 2 Use A Pre-Set Target
This requires having a set price target where you will take profits and exit the trade. This is my preferred method simply because I like to have an idea about where I will get out of the trade. To do this, you should take the size of the opening range and add it to the price at the top of the range. Let me break this down with an illustration
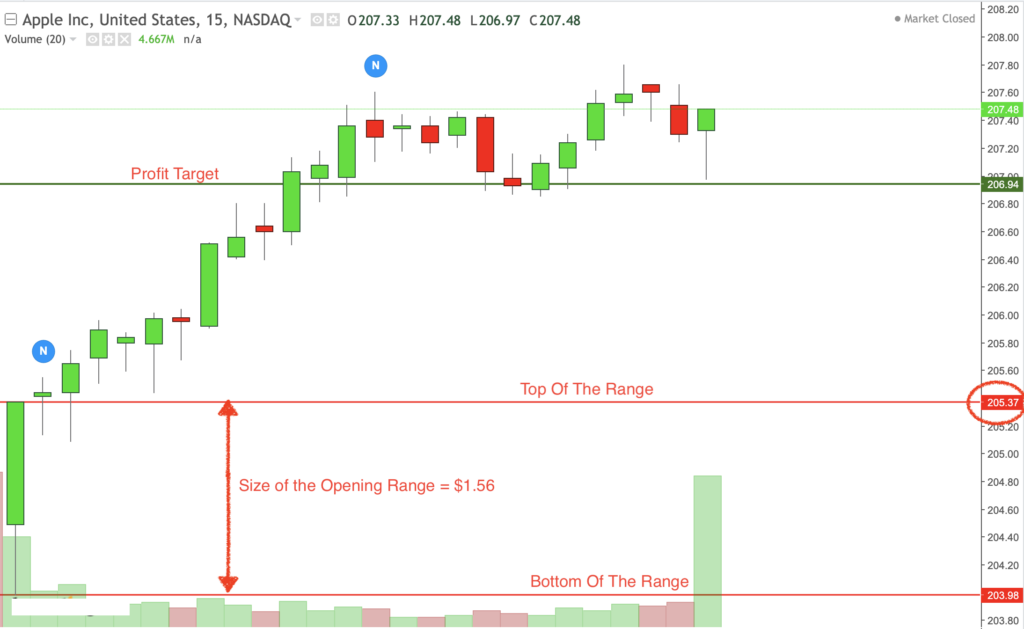
The size of the opening range is 1.56. So to get the Profit target, you simply add 1.56 to the price level @ the top of the Opening Range. So we end up getting 1.56+ 206.37 = 206.93. Understand? Simple right?
In the vast majority of cases, the stock will move to that Profit Target and either stall out above or below it. And, in other cases it will either get above the target and go 2x or 3x the size of the opening range.
But the consistent and almost predictable singles will come from just taking the profit target at 1x the Opening range. What I like to do is to close out the majority of my position as soon as it hits 1x and then I raise my stop and ride the trade just in case it goes to 2x. If it doesn’t then I just close it out and move on.
This is very simple and tremendously powerful once you get the hang of it. So go ahead and re-read that several times if you have to and test it out and see for yourself. It works!
Executing Short Trades
Shorting with this strategy is simply a matter of doing the inverse of what you would do with the long trades. It is very simple and straightforward and I am going to show you how to do it step by step.
Step1: Finding Your Trades
You will find your short trades by looking for the weakest stocks in the weakest sectors and the quickest way to find that info is by using the SPDR Sector Tracker. But remember, you have to start looking for your trades early in the trading session so you can start tracking and preparing your trades.
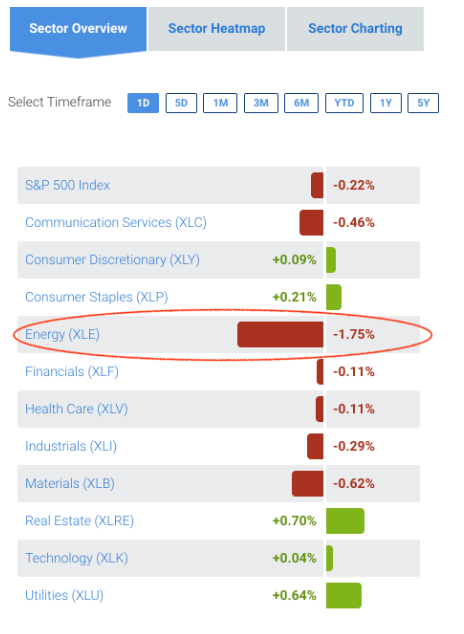
Here you can see that the weakest sector is Energy so the next thing you do is to click on the sector and find the weakest stocks.
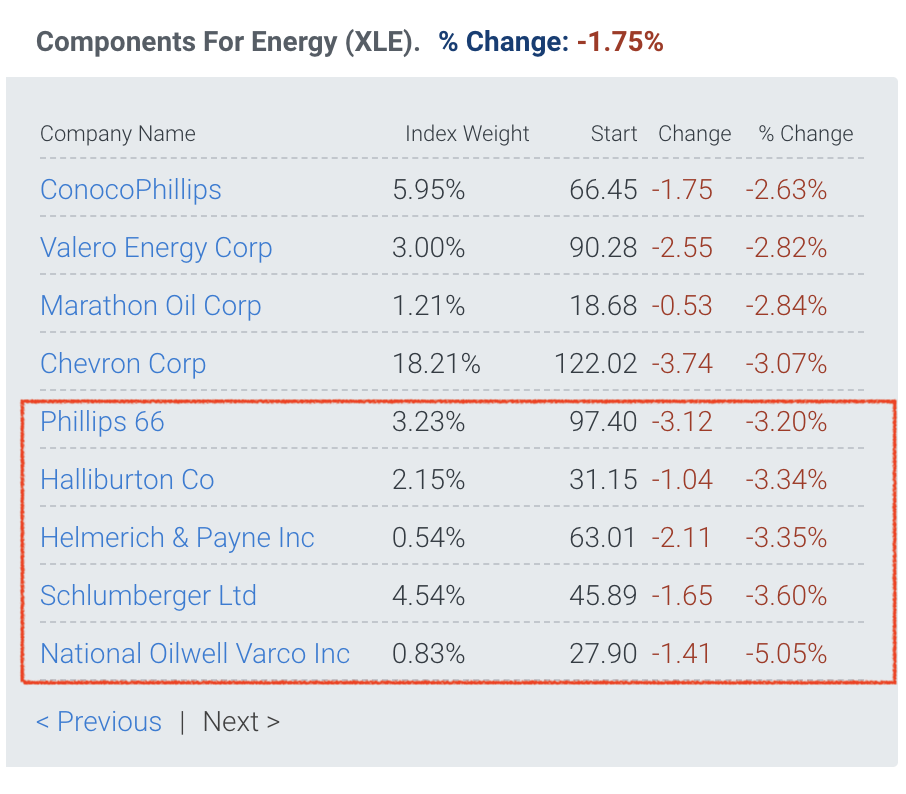
Remember when I told you that when you are going long you have to focus on the top 5 stocks? Well when you are going short, you will have to focus on the bottom 5 stocks to ensure that you are playing the real momentum stocks. In this case, it is downside momentum.
Step 2: Executing Your Trades
Now that you have found your trades, it is time to execute. Remember, you are doing the opposite of what you do when you take the the long trades, so that means the trade is triggered when there is a 15 minute bar that closes below the range.
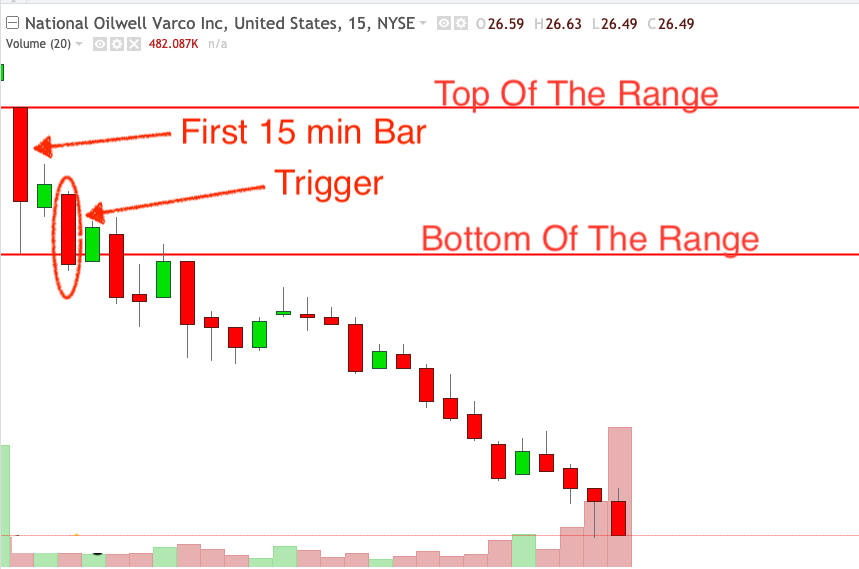
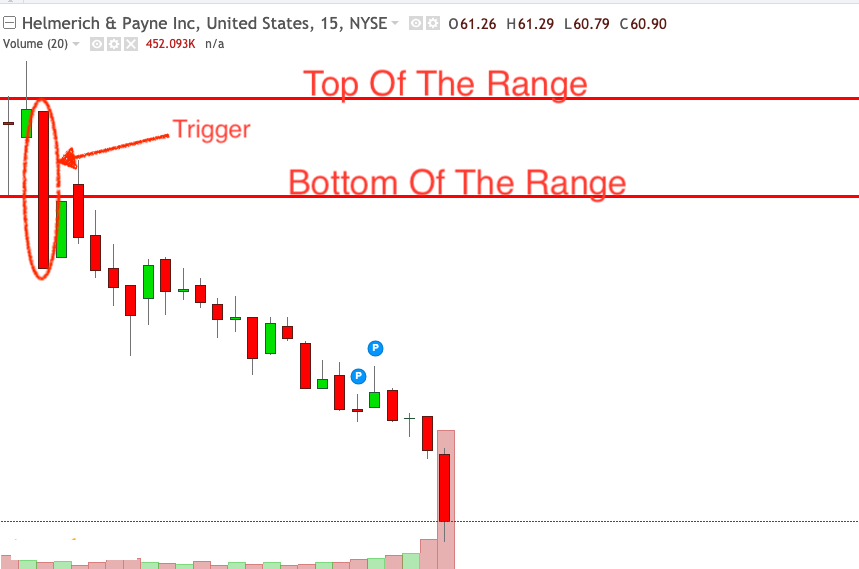
Here are a few more examples of what an ideal short trade looks like with this strategy:
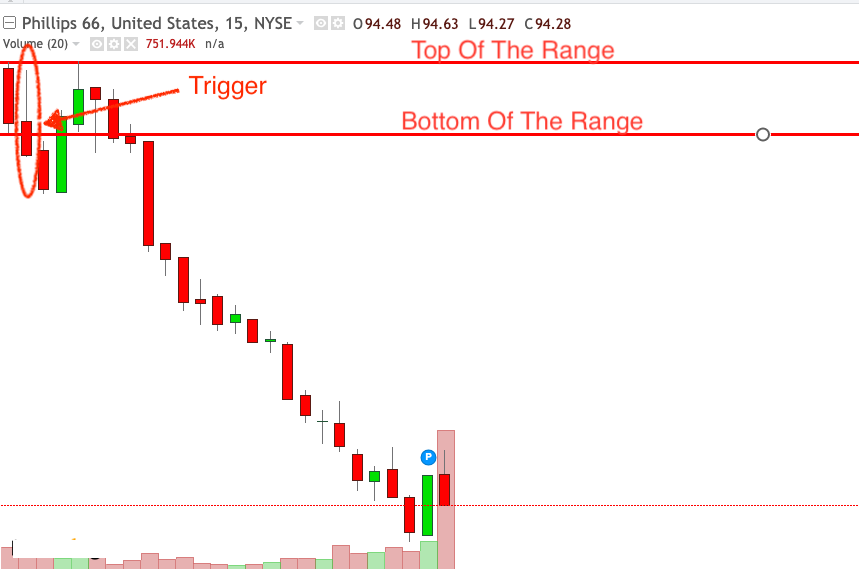
I like this Phillips 66 (PSX) example because, if you look closely, you will see that after it triggered, it rallied and tested the top of the range briefly and it shows the respect that the price tends to have for the Opening range.
Secondly, this is exactly the type of price action that you are going to see in some cases and you should remain in the trade once it doesn’t break the range.
Step 3: Managing Your Trade
By default, your stop loss is going to be at the top of the range and once you have a 15 minute bar closing above the range, you would get stopped out of the trade. Here is what that would look like:
Profit targets are set using the size of the opening range just like you did when going long. The difference now is that now you will be subtracting from the price at the bottom of the range. I will show you how it is done using the PSX example:
The size of the opening range here is .46 so if we set a profit target at let’s say 3x the Opening Range, it would be .46×3= 1.38. So you would subtract 1.38 from the short entry @ 96.54 which would give you a profit target @ 95.16.
Day Trading Options
Well, if you don’t trade options then this is where you get off the bus. But don’t be one of those people who learn new, potentially life changing info and don’t take action. Go test out what you learned. Try it out and see for yourself how powerful this strategy is. Email me if you have any questions.
For the Options traders, I am going to show you how to select the right Strike and Expiration for Day trading and then we will look at how we set Stops and Targets on Options. Let‘s get into it.
Selecting The Right Strike & Expiration
First you should make sure that you select the right expiration, and the right expiration will be a minimum of 3 days out. Let me say it this way: If you are Day Trading Options, you should not be buying contracts that expire in less than 3 days. Why? Because one of the best things you can do for yourself as an Options trader ( especially when you are day trading) is to buy extra time.
The tendency for most retail traders is to buy the contracts that expire in a day or two because they are “cheaper”. That is the wrong approach and I know that because I used to do dumb stuff like that and I got screwed over and over because, if that stock even trades sideways for just half day, the time decay just rips those contracts to shreds. And now those “cheap” .50 cent contracts are now .01 on the bid …and you have 50 of them. Ouch.
The second thing you have to do is buy contracts that are at the money. By default, that is where you want to be. Why? Because your contracts will get “in the money” a lot quicker if the stock moves in your favor. This is one of those simple, obvious things that pays off huge in the long run but nobody does it.
Now, if you can’t afford to get the “at the money” contracts, then there is a simple trick that you can apply that will allow you to go out of the money but still keep you relatively safe from rapid time decay.
The 1.5x Average True Range (ATR) Rule
So here is a scenario, let’s say you had a really small trading account and a maximum per trade allocation of only $250. You have a trade set up on Nvidia (NVDA), its trading @ 190.67 and you like the $190.00 Calls. However, the problem is that these Calls are trading @ 4.49 and your maximum per trade allocation is only $250…now what do you do?
The answer is that you can use the Average True Range (ATR) of Nvidia to help you calculate how far out of the money you can go without exposing yourself too much and this is how you do it:
The ATR basically tells you how much a stock tends to move in a given day. So a .50 ATR means that the stock tends to move about .50 cents ( up and down) in a given trading day. Is that clear? Ok great… let’s move on.
You can find the ATR for any stock on just about any trading platform or charting software. But a really quick way to get that info is to use Finviz. Here is the ATR for NVDA:
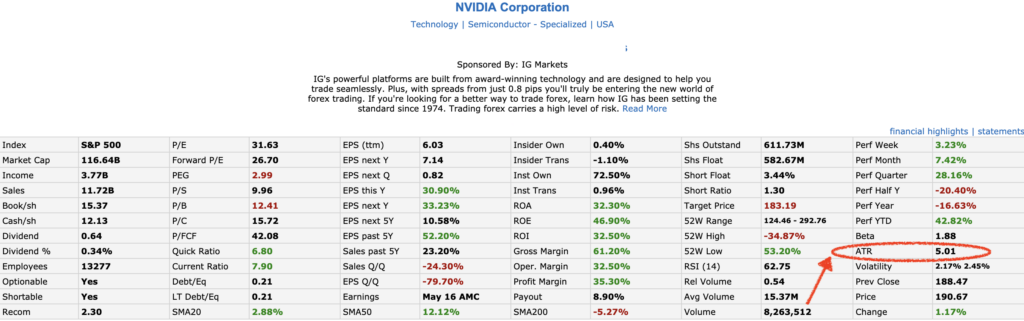
This is the typical data box that would show up when you type in a stock symbol in Finviz. It has a ton of fundamental and price performance data but you should focus on the ATR because that is the data we need.
Next you will have to multiply the ATR by 1.5 which would give you 1.5 x 5.01=7.51.
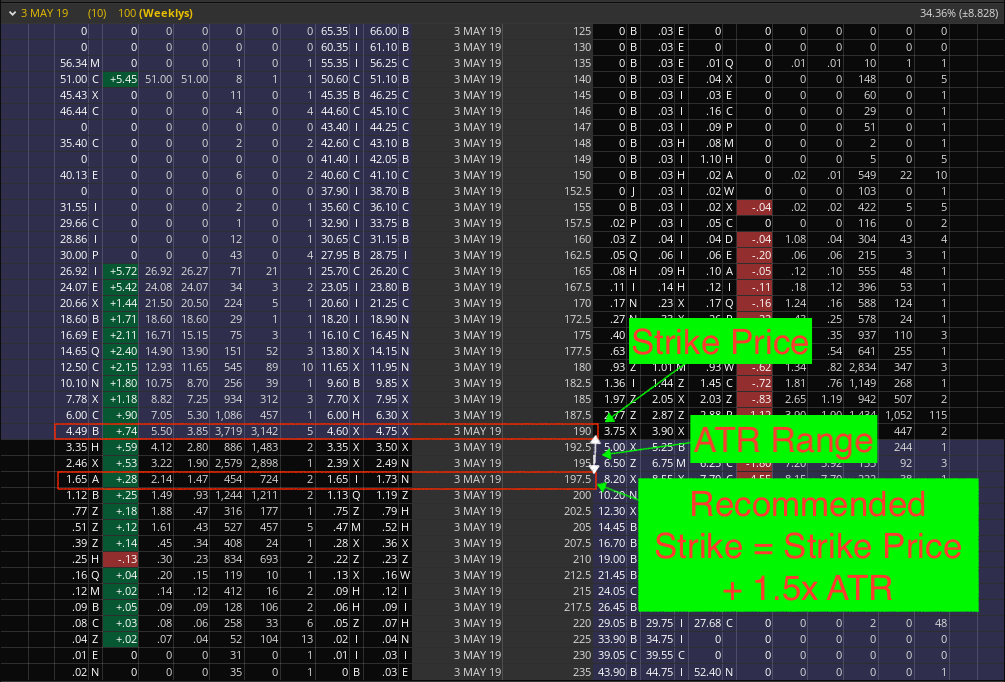
You will then add the 7.51 to the at the money strike price which is 190.00 +7.51 =197.51
Now, this means that with your small allocation you will be able to go as far as, but no further than, the 197.50 Calls.
This simple rule is called the ATR rule and it basically helps you stay within striking distance if you are forced to go out of the money. What it also does is keep you buying contracts in a range that is less subject to rapid time decay etc.
This is pretty much all you need to start making profitable Day Trades whether you trade Stocks or Options. But there is some info that covers how to Set Stops & Targets on the Options themselves + the entire Swing Trading strategy step by step.
The Swing Trading Strategy is perfect if you work a 9-5 job or just don’t have the time to watch the market because it shows you how to take advantage of major moves in the market without having to baby sit your trades. All this info can be found in these Trading videos that I made.


