How To Trade Using The $BPSPX
In this guide I am going to explain what the BPSPX is and show you a simple and very effective way that you can use it to make profitable Swing trades.
The BPSPX Index Explained
The full and proper name for the BPSPX is the S&P500 Bullish Percent Index. It is used to measure the breadth of the S&P500 and can therefore tell you what percentage of the 500 stocks in the S&P 500 are in an uptrend vs downtrend. This is also known as the participation rate because you are seeing the number of stocks that are participating in the upside or downside.
How To Read The BPSPX
The BPSPX index number will tell you exactly what percentage of the stocks are in an uptrend but it is not sufficient to to look at the index number alone. You also want to look at:
(i) The Threshold: There is a 50% threshold on the BPSPX where a reading above 50% means that more than half the stocks in the S&P500 are in an uptrend and therefore the market can be considered to be strong. When the index is below 50% it means that less than half the stocks are in an uptrend and the market is weak.
(ii) The Direction: It is also not enough to just look at the index number and threshold. You want to pay attention to the actual direction of the index as well because you can have a situation where the index is above 50% but actually heading downwards in which case you would have a market that is strong but deteriorating. Similarly, you can have a situation where the index is below 50%v but heading higher and , in this case, you would have a market that is weak but improving.
So looking at the immediate direction of the index is as important as the actual index number and threshold.
BPSPX Chart
There are many breadth indicators that can be found on just about any charting or trading platform but the BPSPX is specific to www.stockcharts.com. You do not need a subscription to access the chart, you can just go to the site and type in “$BPSPX”. Do not leave out the “$” before the actual symbol/ticker.
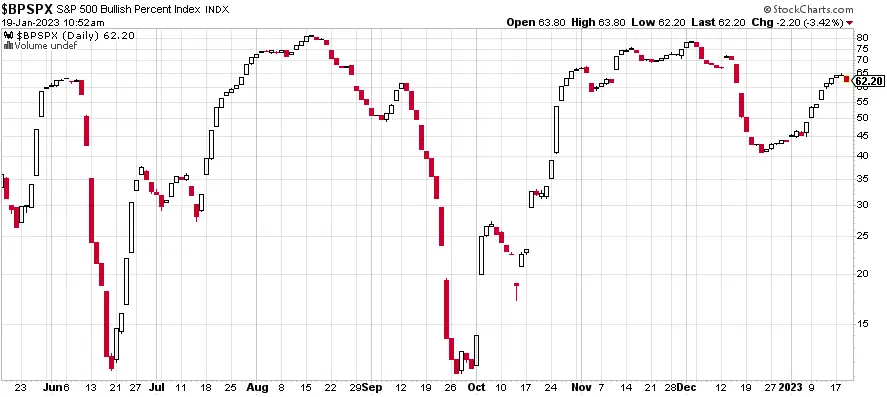
Above is the chart of the BPSPX with the current number at 62.20, which is over the 50% threshold, and the index clearly pointing to the upside. A quick read of this chart shows that 62% of the stocks in the S&P500 are in an immediate uptrend. This is a near term bullish scenario so it basically means that the high probability trades are going to be on the upside.
How To Use BPSPX As An Indicator
In order to use the BPSPX as an indicator, you have to understand that breadth leads price. What this means is that you will usually see a turn in the direction of the breadth before, or at the same time, that you see a turn in the price.
How To Use The BPSPX To Make Big Trades
Step 1: Understand that the best way to use the BPSPX is a part of a larger dip buying/mean reversion strategy because it can help in identifying and confirming turning points. This is more of a mental/strategic adjustment that needs to be made ahead of time.
Step 2: Choose an instrument to trade. The best instrument to use when trading with the BPSPX is the S&P500 ETF (SPY) or something closely related. You can trade single stocks, but you won’t get the benefit of a close correlation like you get with SPY or any other index ETF.
Step 3: Now this is where we actually get into the trading. The first thing is to wait for an extreme reaction to the upside or downside.
Step 4: Set up your BPSPX chart with the RSI2 as an indicator. This will help you to verify if the index is oversold or overbought. (Here is a guide that will help)
Step 5: Pull up a chart of your instrument and, at this point you want to decide how you are going to trade your instrument (SPY) i.e decide whether you will be using Options or trading the underlying.
Step 6: In order to execute your Long trades you only want to see these three things in this exact order:
- An extremely Oversold situation based on the RSI2
- A bullish engulfing or reversal bar on the BPSPX
- A bullish engulfing or reversal bar on the SPY
These are the three things that will get you into the trade and you will manage the trade using the BPSPX which means you would stop out or take profits when the BPSPX gets overbought again.
Similarly, there are three things that will need to be in place in order to execute your Short trades:
- An extremely Overbought situation based on the RSI2
- A bearish engulfing or reversal bar on the BPSPX
- A bearish engulfing or reversal bar on the SPY
These are all conditions that must be in place in order for the trade to have the highest probability of working. Any compromise will lower the chances of making a profitable trade.
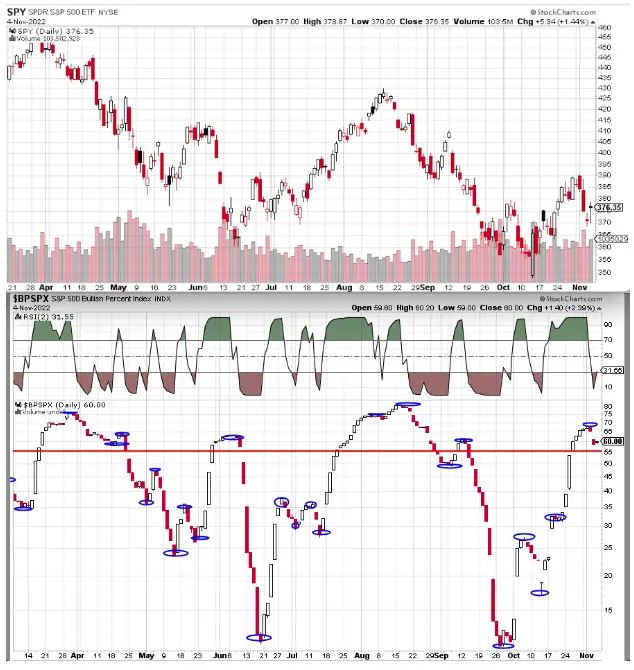
This next image is a chart of the BPSPX below a chart of the SPY. The turning points on the BPSPX are highlighted by the blue circles and you can clearly see the Oversold & Overbought levels on the RSI2 above.
As you can see, this is a complete trading strategy all by itself.
It is very simple and straightforward and easy to execute. However, just like all trading strategies, it will take practice and time for you to get it right.
Furthermore, risk management and position sizing are what will make the difference here because even the best strategy will yield losses without proper risk and money management.
I hope this gives you a better understanding of the BPSPX and how to use it in a practical way. Be sure to check out the other Trading Strategies