RSI 2 Mean Reversion Swing Trading Strategy
The trading strategy that you are about to see has been making money for many years and currently has a 76% win rate under normal market conditions. Make sure you test it out for yourself after you read this.
It can be used for both Day Trading & Swing Trading, so I am going to show you how the SwingTrading method works and then we will look at the Day Trading but first, I want to briefly explain why this strategy works so, if you decide to start using it, you will actually understand what you are using.
The Basic Principle Behind The Strategy
The strategy is largely based on the fact that the market tends to overreact on moves to the upside and the downside. These extended moves (also known as Overbought & Oversold) eventually get to a point of exhaustion but not before “trapping” the traders who chased the move.
Once these traders realize that they are trapped, there is usually a frantic move to correct themselves and get out of the losing positions.
This is what provides the edge in this strategy. You make money by trading against these people. Makes sense? Ok let’s get into the strategy.
The Trade Set Up
Remember that in order for the strategy to work you will need to be able to see 3 things:
- When the market is extended & exhausted (overbought/oversold)
- A confirmation of the extension &
- Evidence that the trend is about to change
All of these conditions have to be in place in order to get the really high probability setups.
You could use simple Price Action to spot this on any price chart but it can take as much as 18 months (several market cycles) to learn to use Price Action, so you will need to use some tools/indicators instead.
These are the indicators you will need and an explanation for why you need them:
1. Relative Strength Index (RSI)
This is a standard indicator but, as you will see, you are going to use it a bit differently. The RSI is basically a tool that measures buying and selling pressure over a certain period of time ( typically 14 periods) in order to determine if a stock is overbought or oversold.
That determination is based on the parameters set at 30 ( oversold) and 70 (overbought). Take a look at the chart below and you will see a chart of the S&P500 ETF (SPY) with a standard RSI(14) applied to it.
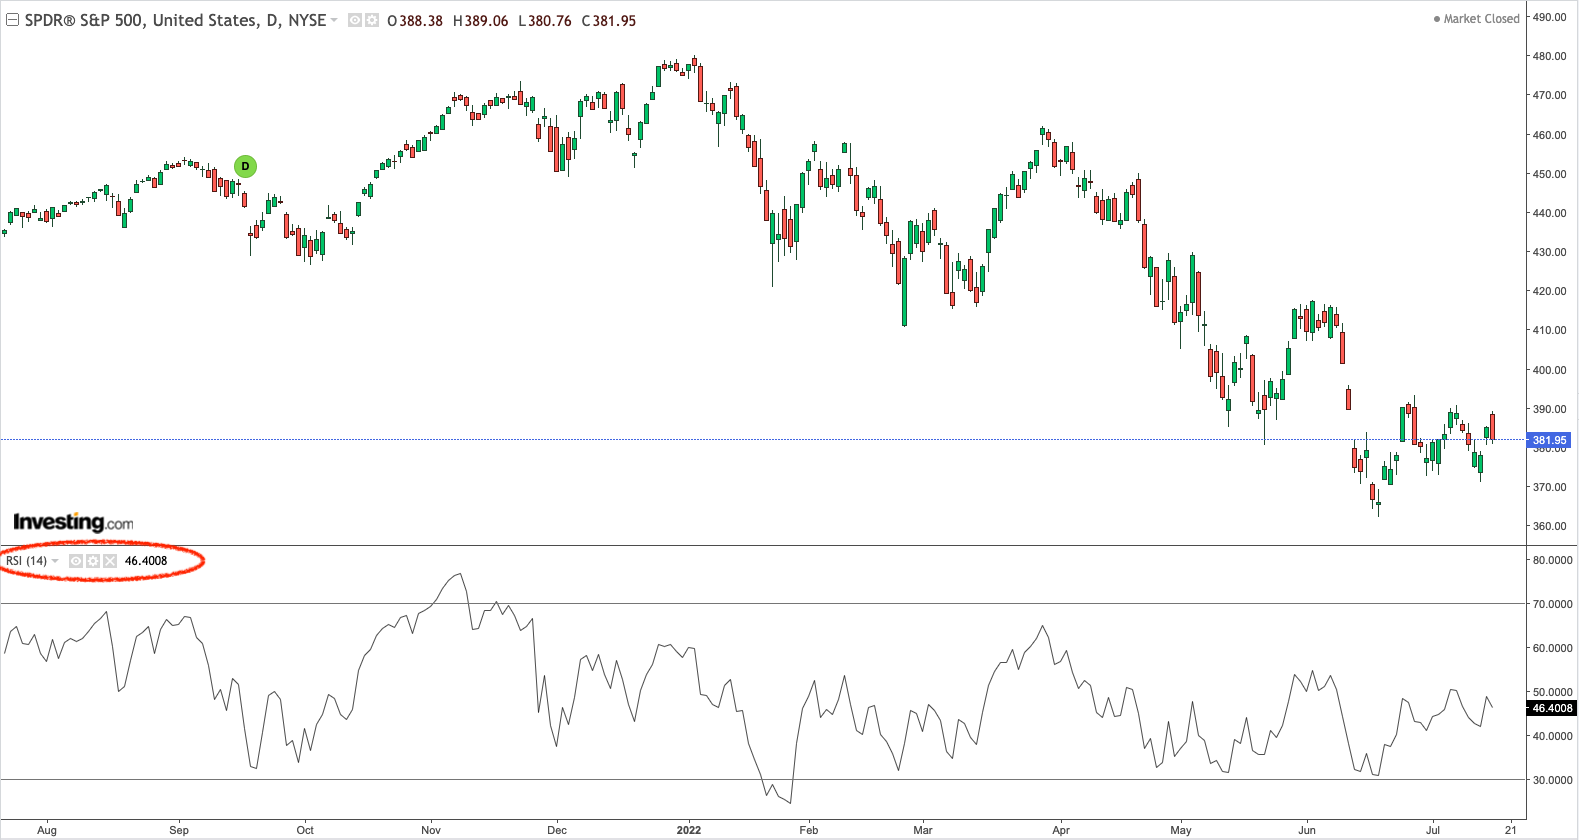
The problem however, is that the RSI(14) doesn’t work as well as it used to in terms of spotting the price overbought/oversold levels.
I can say this because I have access to a system that has been trading the SPY & QQQ using the RSI(14) since 1997 and it has been underperforming for more than two decades.
It is still a profitable system but it has been making less and less money over the years.
As a result what you are going to do is use the RSI(2) setting instead of the RSI(14) because it moves much faster and tends to hug the price movement a lot closer so it can show you the price extensions a lot faster and clearer.
And once you can see these levels, it puts you in a position to take advantage of the traders who might get trapped there.
When you look at the chart below, you will see that there is a big difference between the information you get from the RSI(2) and the RSI(14). The parameters have been changed so that 95 is now considered to be overbought and 5 is the oversold level.
The change in parameters is necessary because the RSI2 moves so fast that it pushes the range outward. Take a look at the chart:
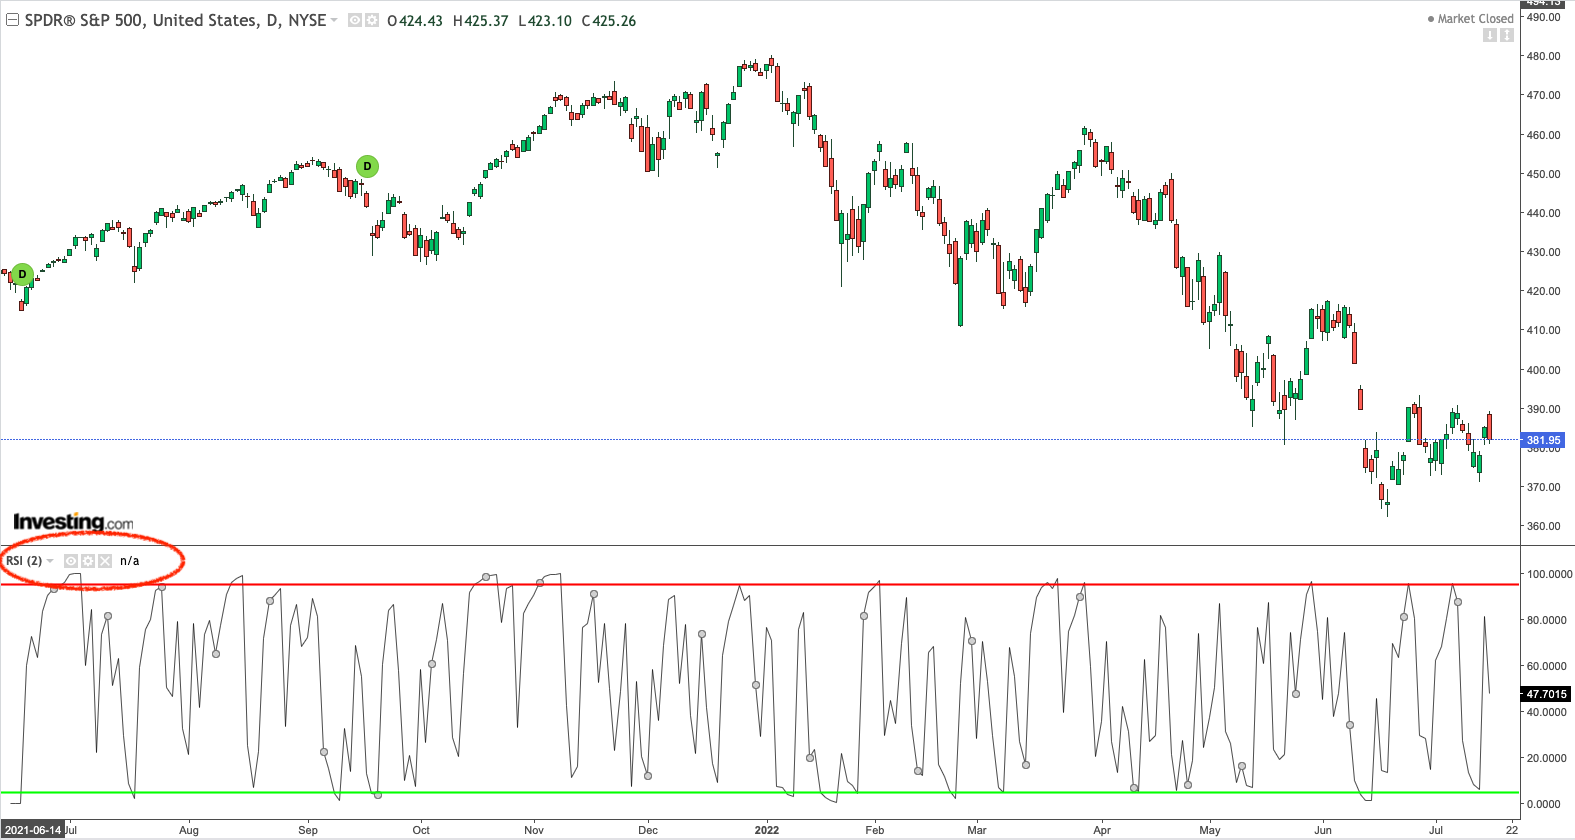
The most important thing to take note of is that once the RSI(2) interacts with the 95 or 5 levels, it is basically telling you that the market is over extended and there is a high probability that you will see a change in direction.
In fact, the probability of a change in direction is actually 65%-75%. And this is what forms the basis of the strategy. Just think about it, by looking at the RS(2) you will know that:
(i) When the market gets extended there are traders who chase the move lower/higher and get trapped &
(ii) You can gauge the extension by using the RSI(2) which gives an actual probability of a turn/reversal.
2. The MACD
The second tool you need is the MACD. It is a popular indicator that is normally used as a trend & momentum tool but, as you will see, you are going to use this a little differently in order to make this strategy work.
The MACD consists of the fast (blue) and slow (red) lines as well as a Histogram. The general rule is that when the fast line crosses the slow line, there is a change in trend. Another thing to note is that the distance between the fast and slow lines represents the strength of the trend i.e the wider the distance between the fast and slow lines, the stronger the trend.
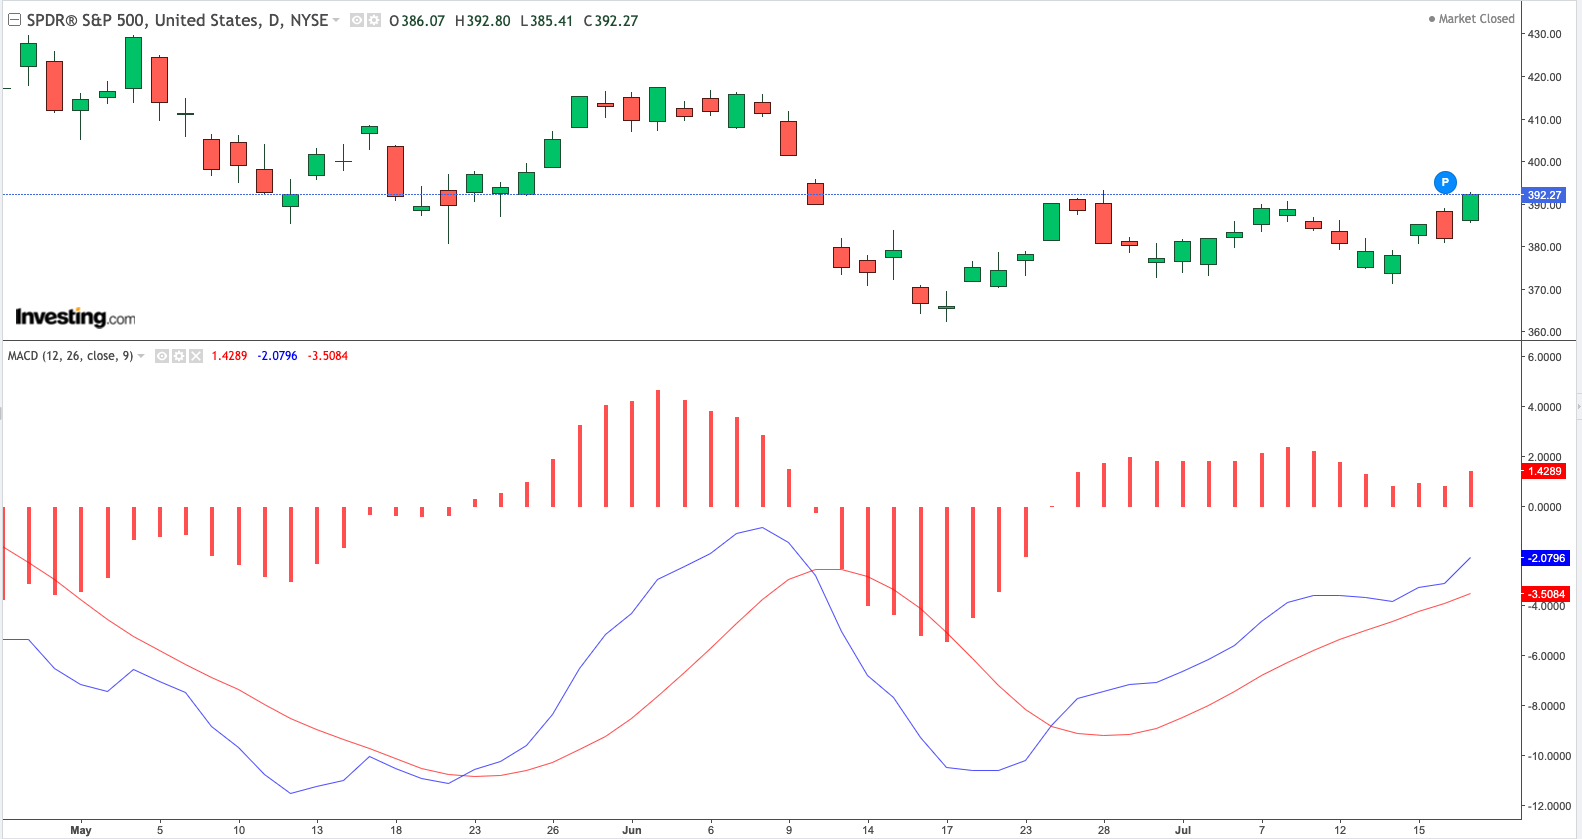
Keep the standard MACD setting but use the tool as sort of a cycles indicator . More specifically, you are going to use this to help to determine when a trend is about to begin or end by looking at the size of the bars in the histogram.
The idea is that the bars will get longer as the trend gets stronger and will peak when the trend ends, and then shift to shorter and shorter bars as the trend weakens.
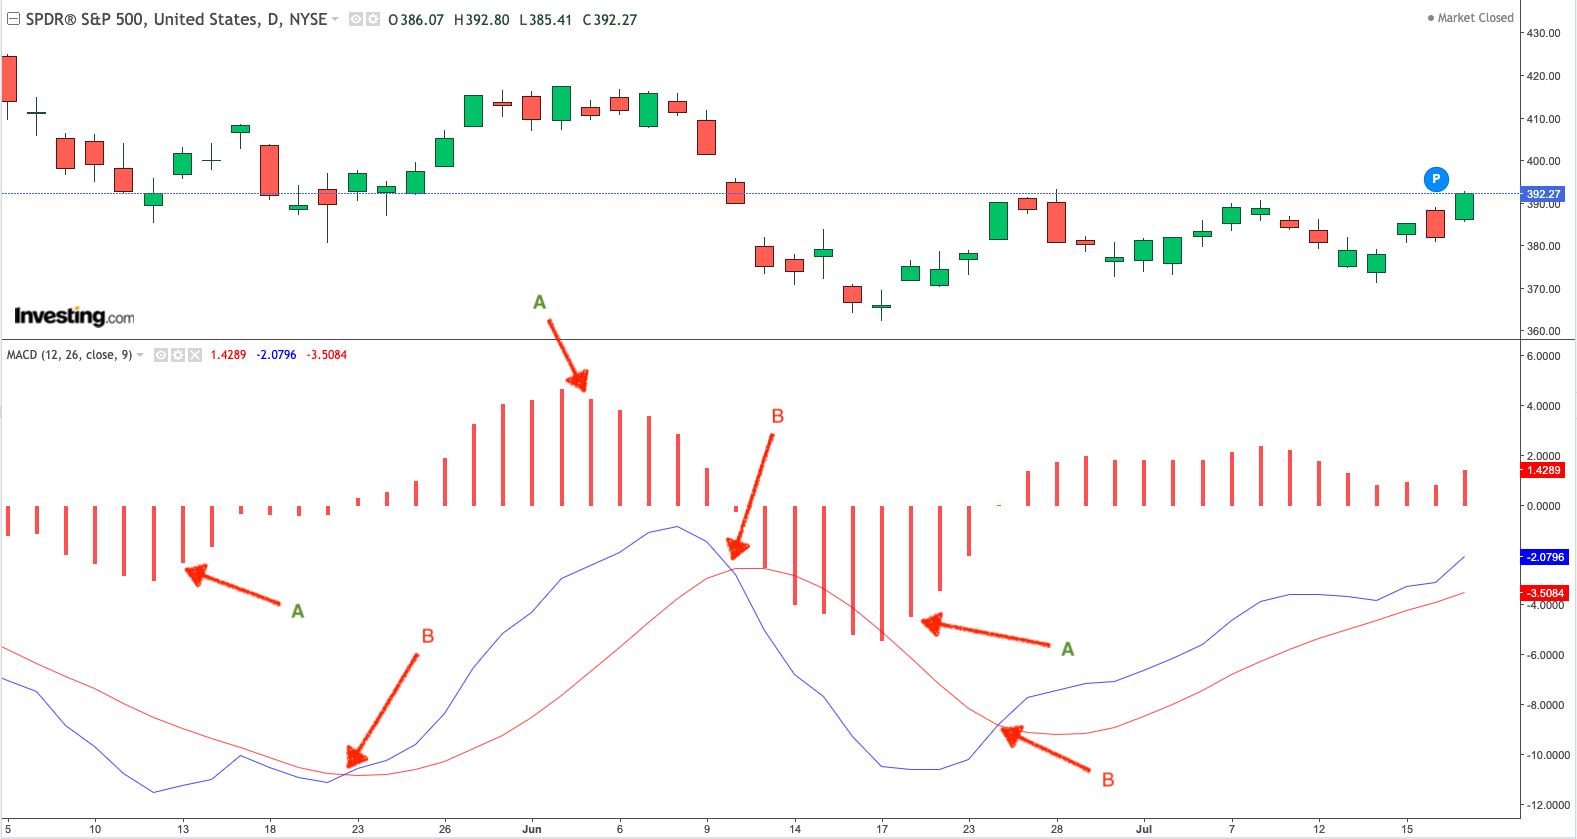
The arrows marked with “A” show you a more timely entry using the histogram and “B” shows you the typical entry of most traders.
As you can see, by focusing on the histogram bars, and using the MACD as a cycles indicator, you will consistently get into the positions right as the trend is about to shift as opposed to waiting for the lines to cross. This is a key part of the strategy as you will see shortly.
Now let’s take a look at the 3rd and final indicator that you will be using in this trade setup.
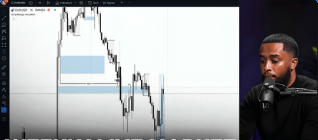
3. Heiken Ashi
The Heiken Ashi is not necessarily an indicator. It is just another charting method that happens to use averages to represent the price history.
This has a “smoothing” effect on the chart and effectively takes all the “noise” out of the price action. So the upside is that you can clearly see the turning points where real buyers or sellers step in and you can clearly see who is in control just by looking at the color of the chart.
The downside is that it tends to lag the regular Candlestick chart movement to the point where the closing prices on the Heiken Ashi chart can be significantly different from that on the regular Candlestick chart.
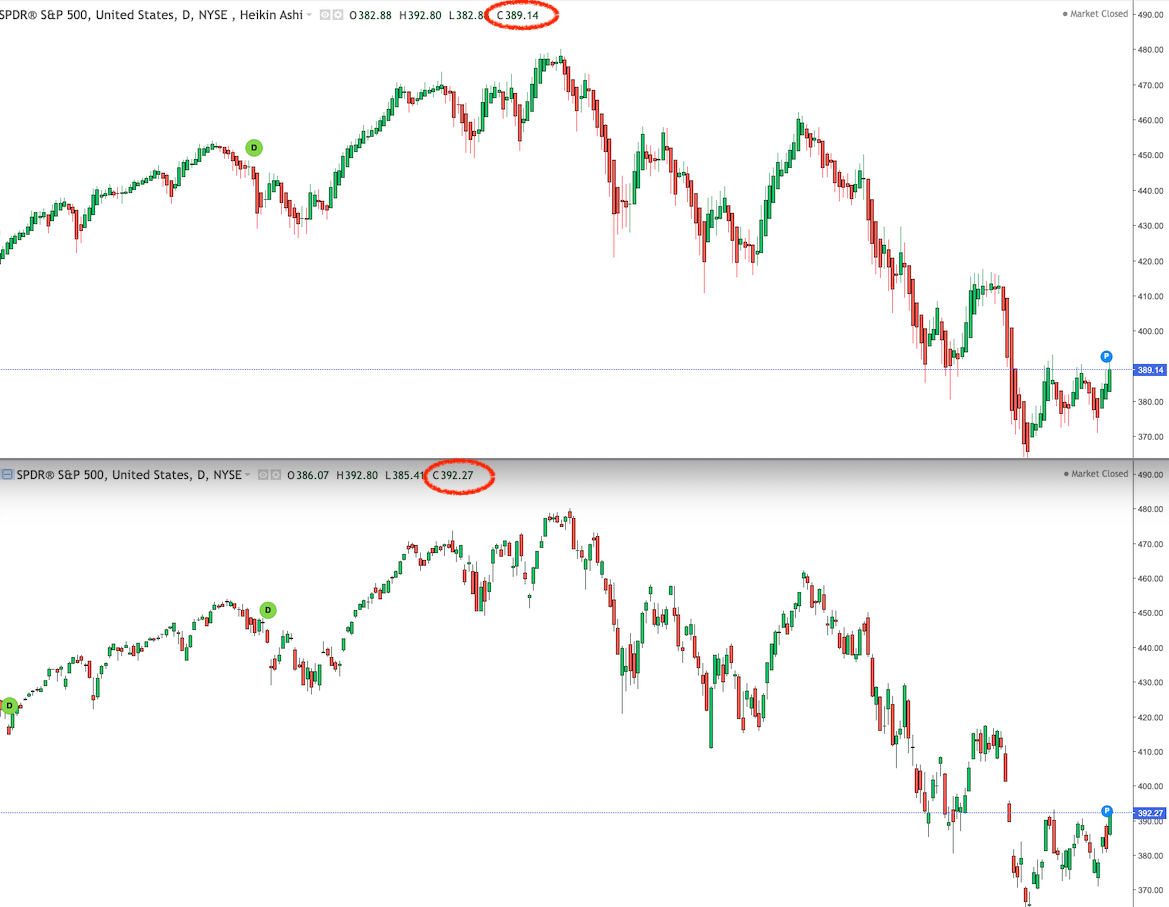
For some traders this is a big problem and they just totally avoid using the Heiken Ashi but it works just fine as far as it relates to this particular strategy. This is because of the fact that we are more interested in the actual price action of the Heiken Ashi and not the closing prices.
In other words we are using it so we can see when buyers and sellers are coming in and whether the buyers or sellers are in control.
Plus, what some people see as “lagging” is actually just a better entry in the case of this strategy because the Hekien Ashi just does not move unless/until there is significant buying or selling pressure.
Now that you know the indicators/tools you need and why you need them, next you are going to learn how to tie them all together to create a system that produces very high probability trade setups.
The Execution
Now you need to combine all 3 indicators so they can give you the information that you will need to enter your trades.
Going Long
You want to see a situation where the stock/ETF that you are looking at is extremely oversold or, recovering from an oversold situation based on the RSI2, and the MACD has to be “bottoming out” or indicating that a new trend may be starting and you also want to see the Heiken Ashi turn green.
Going Short
For a short trade, you would need to see the opposite i.e the stock must be overbought/extended based on the RSI2 reading of 95 or above and the MACD should be “peaking” or turning down and indicating that a new downtrend may be starting and you also want to see the Heiken Ashi turn red.
Here is the actual formula that you will use for your setup:
Long= Oversold (RSI2<5) + MACD Bottoming + Heiken Ashi green
Short= Overbought (RSI2>95) + MACD Peaking + Heiken Ashi red
This image be low is a representation of how i have my set up written on the whiteboard above my desk. This helps me to visualize what a good setup looks like. It is a simple drawing but it has helped to burn this strategy into my subconscious mind and I have no doubt this is one of the reasons I became very good at trading this set up.
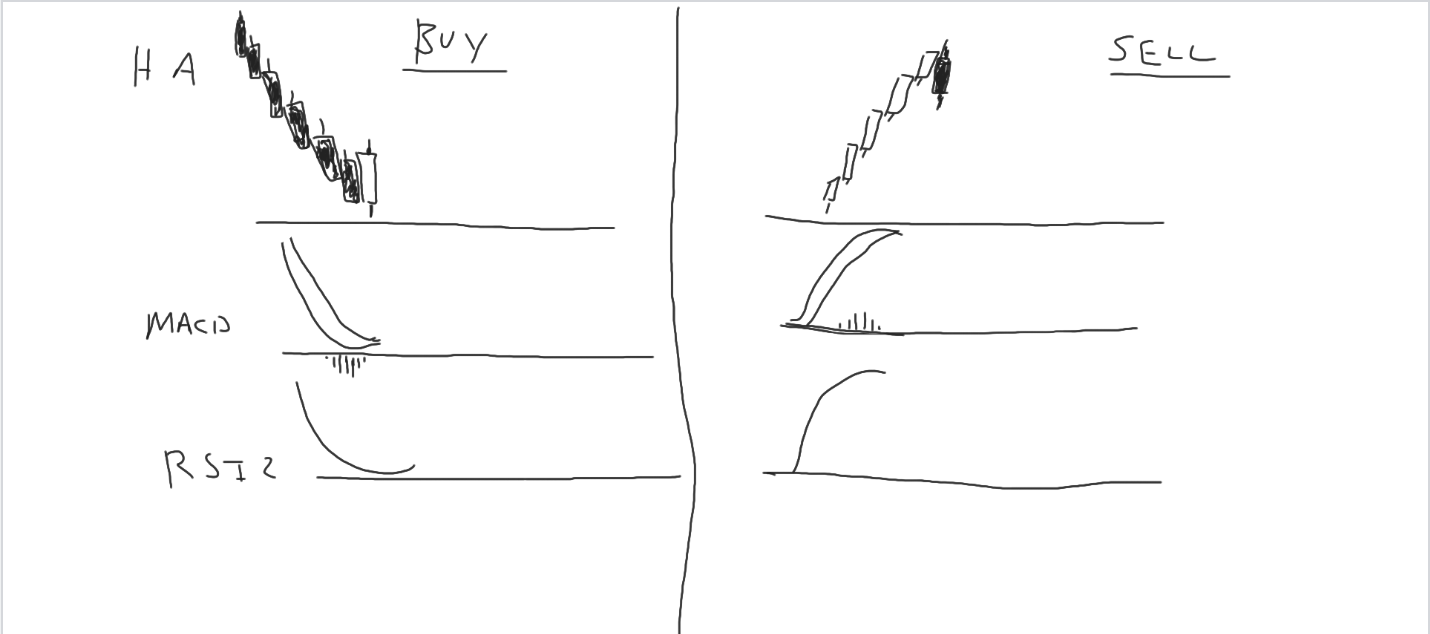
This is what an “A” setup will look like on your chart. If it doesn’t look like this, it is not an “A” setup and the probability will be less than the 75%-80% that is built into the system. Once these conditions are present you will be able to successfully “buy the dips” or “sell the rips” and benefit from trapped traders 75% -80% of time.
The Process: From Trade Entry To Exit
You now know how the strategy works, why it works and what tools/indicators you will need to make it work, as well how to use them. Now you will see what the exact process entails and the exact steps you will need to follow if you want to have the consistent 80% positive expectancy that the system can give. Here is the process:
Step 1: Check The Context/ General Conditions
The first step is to check the broad context or general condition of the market. It is always good to know what kind of environment you are trading in because it can make a big difference in the outcome of your trades.
For instance, you would want to focus on short setups in a weak market and you should focus long setups in a strong environment. I am not going to go into how you can check the context again because I already covered that in the Breadth trading article. Go take a look at it, it is by far the best way to gauge the market sentiment and underlying conditions.
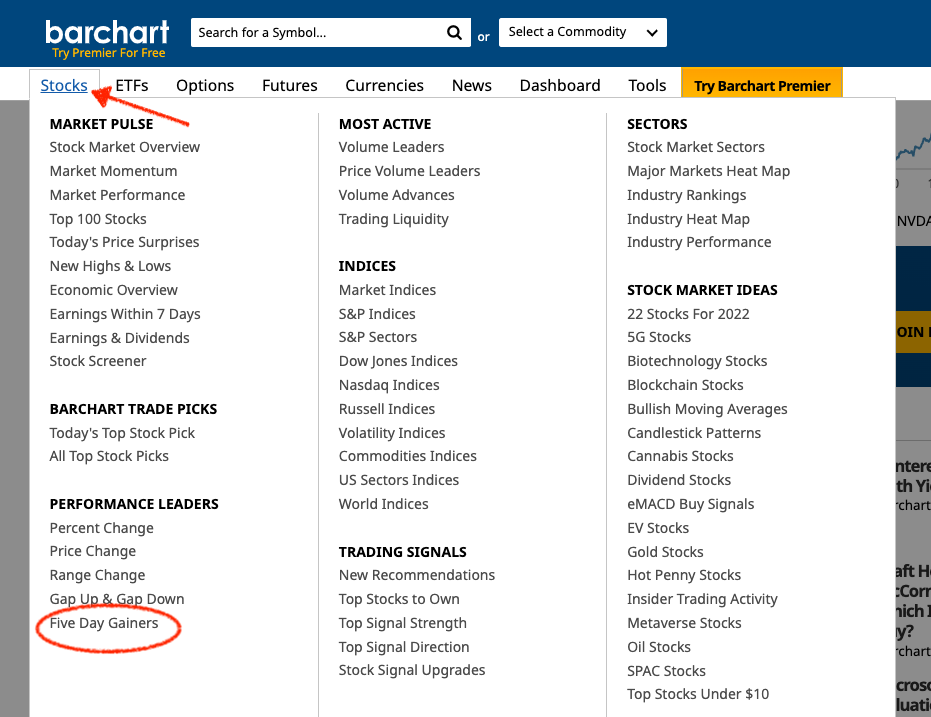
Step 2: Identify The Stocks/ETFs You Want To Trade
There are two ways that you can go about finding suitable stocks for this strategy. The most efficient way is to run a scan that will unearth stocks that already meet the criteria for the most part. I have two pre-built scans for Thinkorswim that provide setups on the long side and the short side. You can copy them here:
http://tos.mx/p5hNUba ( Bullish)
http://tos.mx/JfwS6mg ( Bearish)
These bullish scan will show you stocks that have already hit oversold levels and are starting to turn up with a green or bullish Heiken Ashi. The bearish scan will show you stocks that have already hit overbought levels and started turning down with a red or or bearish Heiken Ashi. The scan takes you several steps into the process and saves you time.
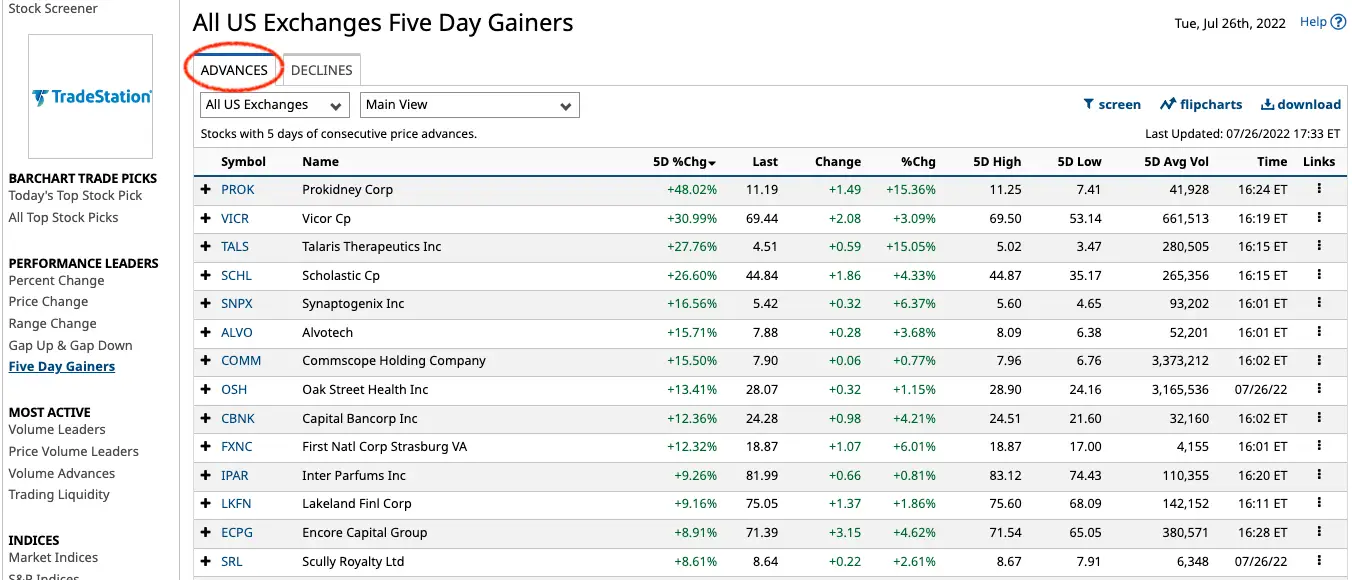
If you can’t use Thinkorswim, you can use the five (5) day gainers or losers list on Barchart. You can find these trades manually by going to Barchart then click on “stocks” and scroll all the way down to “Five Day Gainers” . You don’t need a Barchart premium subscription for this.
There you will see a list of stocks that have been going up for five days or more and may very well be overbought. If you click on “losers” then you will see a list of stocks that have been going down for five days or more and may be oversold and ready for a bounce.

Step 3: Evaluate Your Trades
This step can save you a lot of time because you get to see if the oversold or overbought stock you found on your scan or Barchart list is worth your time. You basically want to make sure that the stock is going to move by making sure that they meet the following criteria:
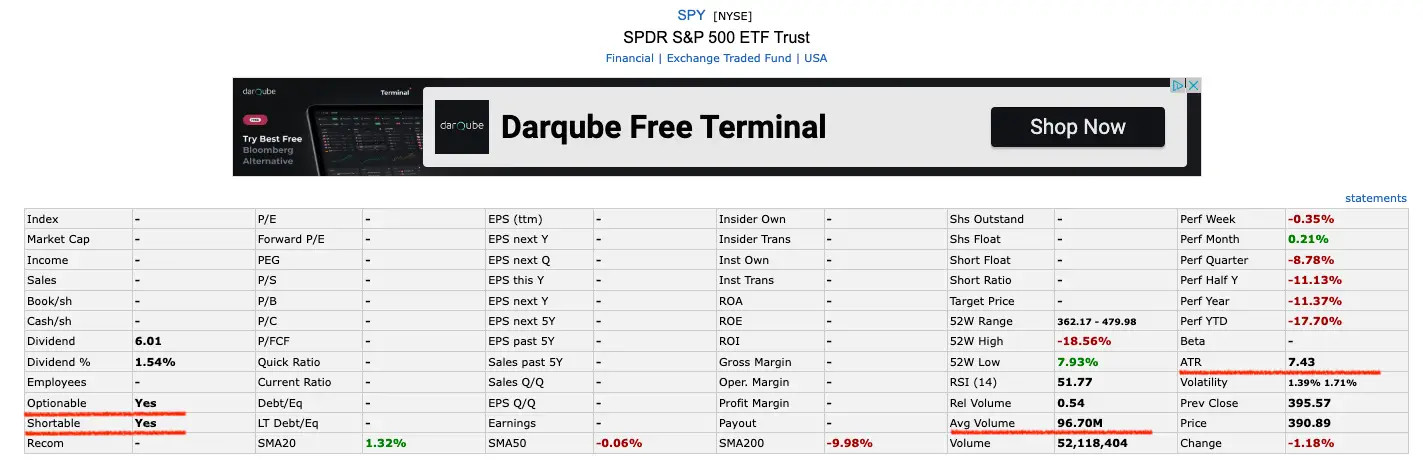
Average Volume > 750,000 shares
An average daily volume of about 750k is fairly liquid and guarantees some normal level of movement. You basically just want to make sure that you can exit a trade as easily as you enter it.
Average True Range (ATR) >.85 cents
The Average True Range (ATR) is a volatility measure which can also give you an idea of how much a stock tends to move up or down in a given day. So an ATR of .85 cents is basically telling you that the stock tends to move about .85 cents in a day. That could be .85 cents up/down or a split of .45 cents up and .40 cents down. The main point is that, this is the amount of movement. A minimum of .85 cents guarantees some decent volatility.
Optionable & Shortable
Finally, stocks that are Optionable and Shortable tend to be more liquid. So this requirement is just another liquidity lever, so to speak.
Selecting your stocks based on these criteria will keep you out of slow trades.
The quickest way to gather this info is to use Finviz because you can find all that data in one window. The alternative is to build some kind of a scan. Here is what it looks like with the SPY ETF.
Step 4: Set Up Your Trade
This is where you will plug your stock into the chart to see if it is a good setup or not. To make this step easier and develop some level of discipline, you will need to use some form of a checklist. This is the one I use for every trade I take with this strategy. The criteria on the left, and a check box on the right.

I usually just scribble down a new checklist for every trade on a piece of paper but here is an extended version which includes all the evaluation criteria for those who need that extra discipline.

The checklist really simplifies the decision making process because you would basically only take a trade if all the boxes are checked. Anything less is likely to give you a lower probability trade.
Step 5: Enter The Trade
This is where you get to pull the trigger. Once you’ve done all the work and all the boxes are checked there is really nothing to think about. You have to suppress your natural urge to second guess and harbor doubts and just do what your system is telling you to do.
If you’ve done everything right then the signal will be 100% clear and you will know what to do, so just do it. It is a psychological thing at this point.
One of the things that will make it easier for you to pull the trigger is if you have a plan to manage the trade i.e you know when to get out if you are wrong and when to take profits. Trade/Risk Management is being presented here as the final step in the process but it is by far the most important part of the process.
Step 6: Manage The Trade
This is where you set your stop loss and target. For this strategy there are two ways to go about it. You can either use a “trend following” method or you can use pre-set Stops & Targets based on the stock’s ATR. I am going to show you both:
Method 1: The Trend Following Approach
This is pretty straightforward because all you have to do is use the Heiken Ashi to manage the trade. In this case you will even find that the Stops & Targets are one and the same because you will only exit a trade when the Heiken Ashi flips.
For instance, if you entered long on a green Heiken Ashi, the only time you should be getting out of that trade is when it turns red. So if it flips red before the trade is profitable, then that means you were stopped out for a loss and if it flips red when you are up a few points, it means you took your gains.
So, trend following in terms of this strategy is just simply following the Heiken Ashi once you get triggered into a trade. Here is an example of a short setup in Ovintiv Inc (OVV) that is managed with the trend following approach.

The important points to note are that:
At point 1, you can see the stock is Overbought as the RSI(2) is above the 95 threshold.
At point 2, you can see that the MACD is peaking. Notice how the histogram bars are getting shorter as the price pushes up?
At point 3, you can see that the Heiken Ashi flipped red. These are the three primary conditions to trigger a trade.
This next chart shows that the trade management was simply a matter of staying in the trade as long as the Heiken Ashi remained red.
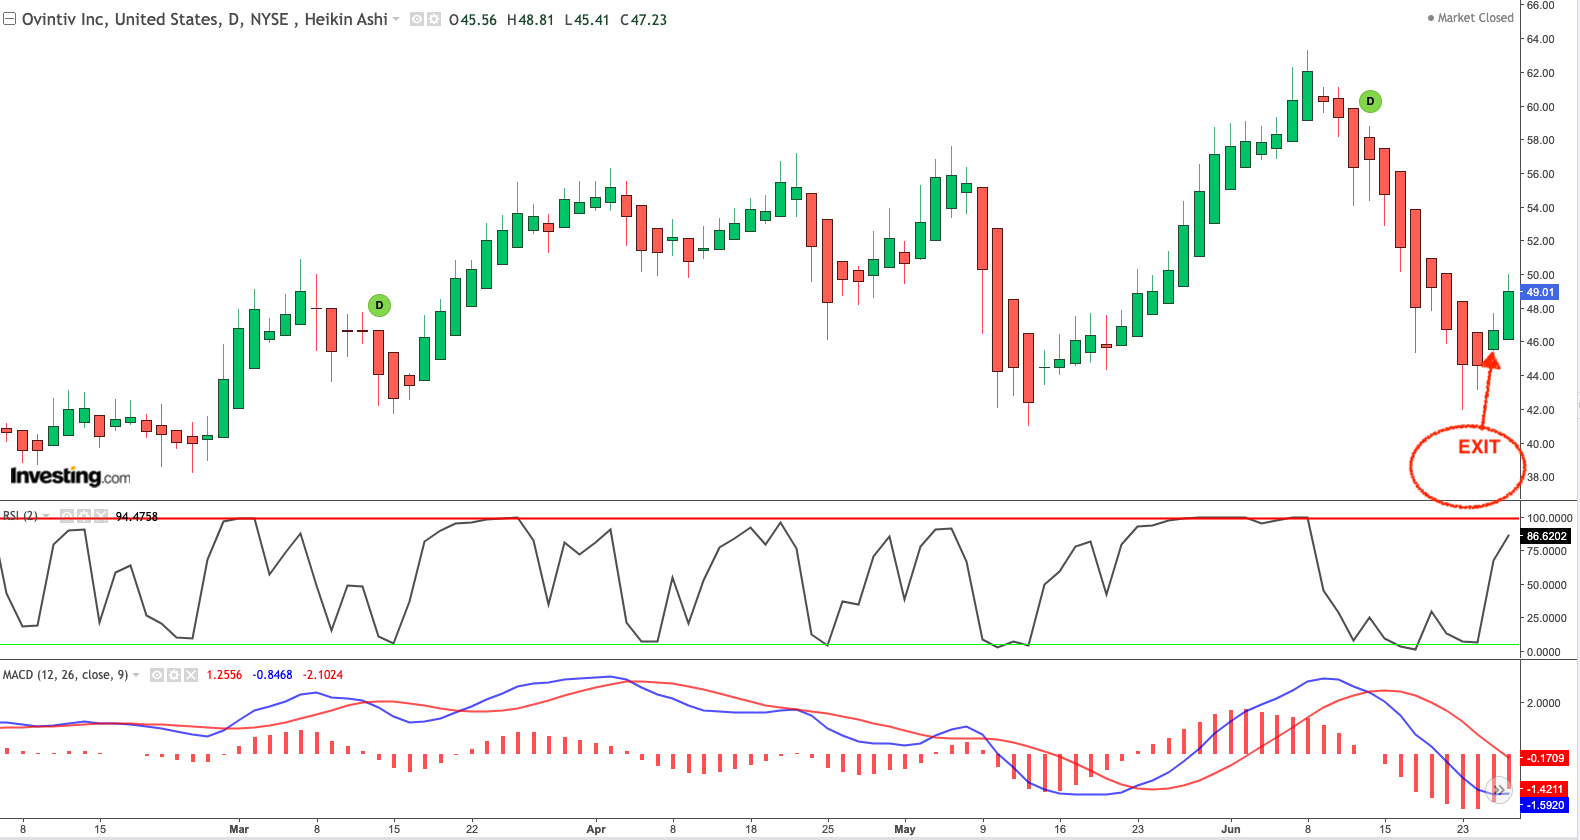
The obvious benefit of this approach is that the potential upside on your trades will not be capped as you will simply be checking near the end of every trading session to see if your Heiken Ashi trend is still intact.
But the downside is that you will not have a fixed max risk or stop loss either and that has its own negative implications. At the end of the day it really is a matter of which approach you are more comfortable with. Now let’s look at the other method.
Method 2: Using Pre-Set Stops & Targets
If you dislike the open ended nature of the Trend following approach then it means you will rather know exactly (to the penny) where you will stop out and where you will take a profit. This is how its done:
Step 1: Get The Stock’s Average True Range (ATR)
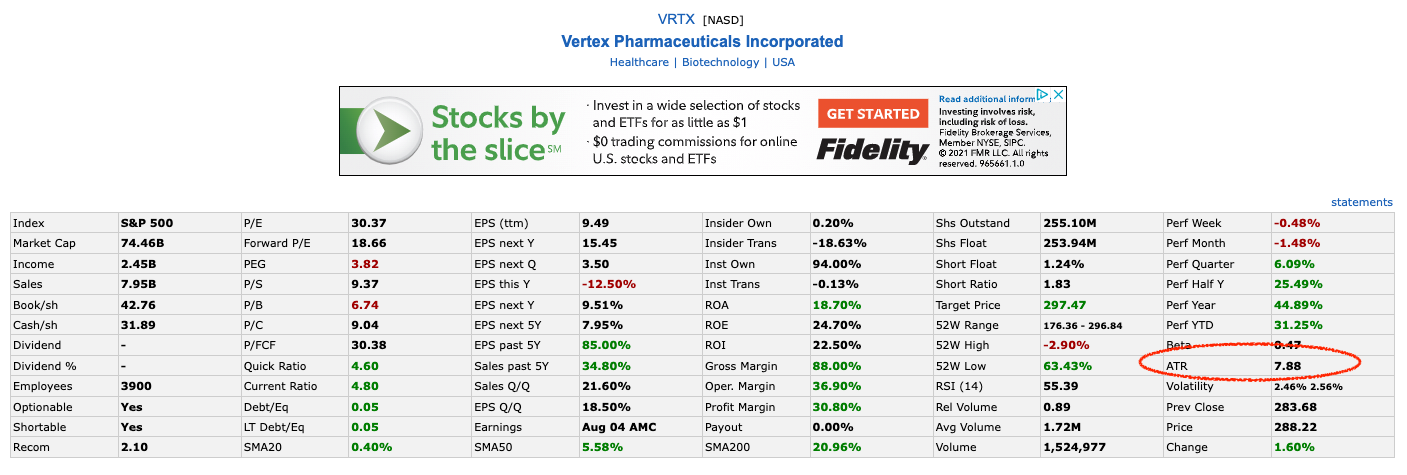
You would already know the ATR of the stock you are getting ready to trade from going through the evaluation process. Let’s use Vertex Pharmaceuticals (VRTX) as an example here. According to Finviz, the ATR is 7.88. Stick that number to the side because we will get back to it.
Step 2: Determine Your Risk vs Reward Ratio
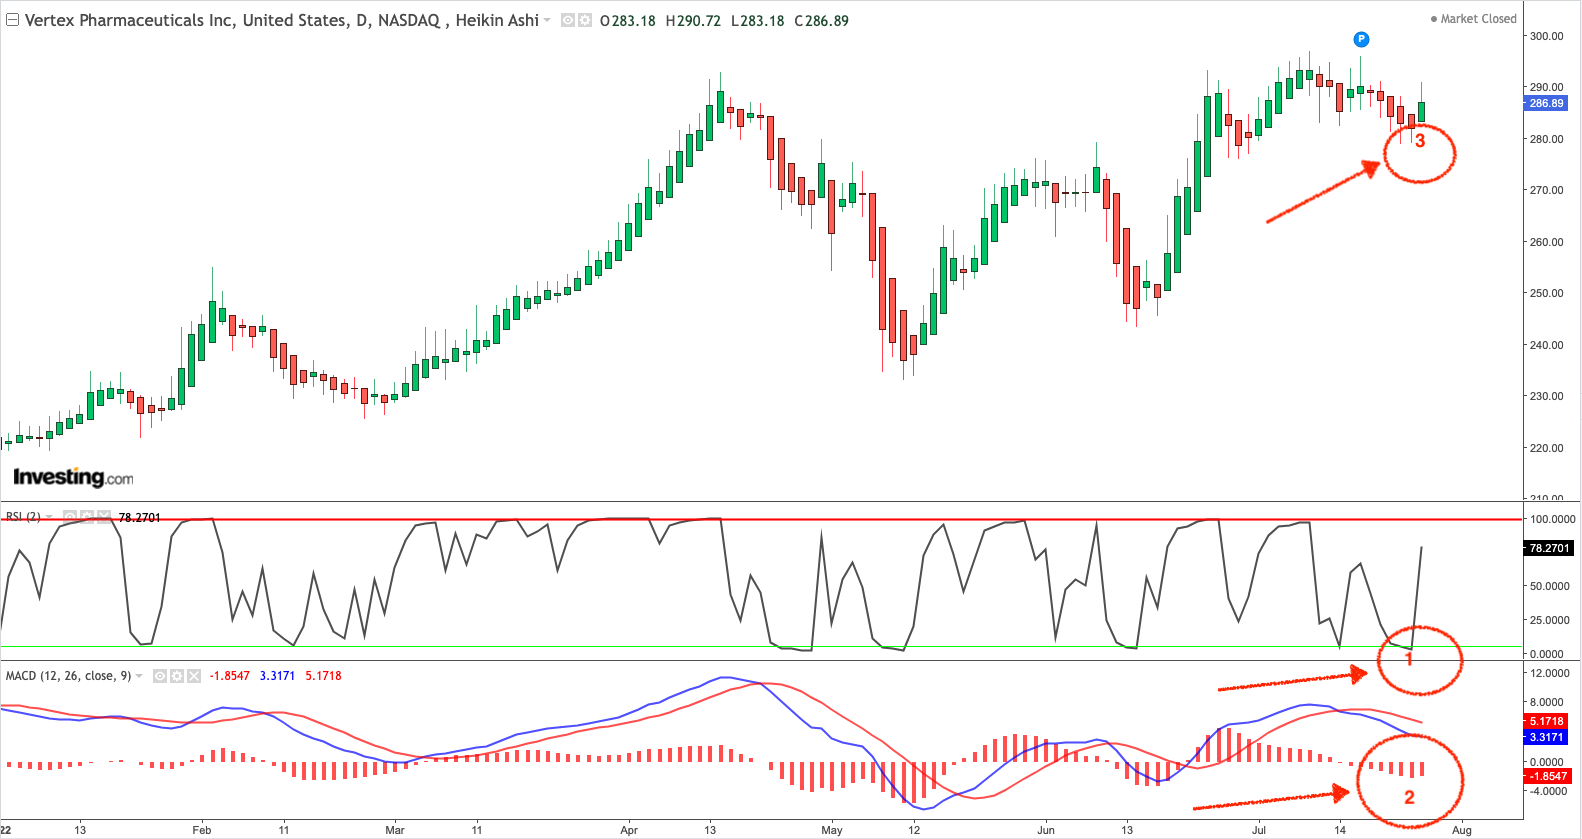
As you can see, it has just triggered a Buy signal on the daily time frame. At point 1 the RSI2 was less than 5, at point 2 you can see the MACD bottoming based on the fact that the Histogram bars are getting shorter and at point 3, you can see the Heiken Ashi flipping to bullish/green. These are the conditions that you need to see for a good long trigger.
Keep it simple and use a 2:1 risk/reward ratio so, you want to set your Stop loss @ 1x ATR and your profit target @ 2x ATR.
Step 3: Place Your Stop Loss & Profit Target
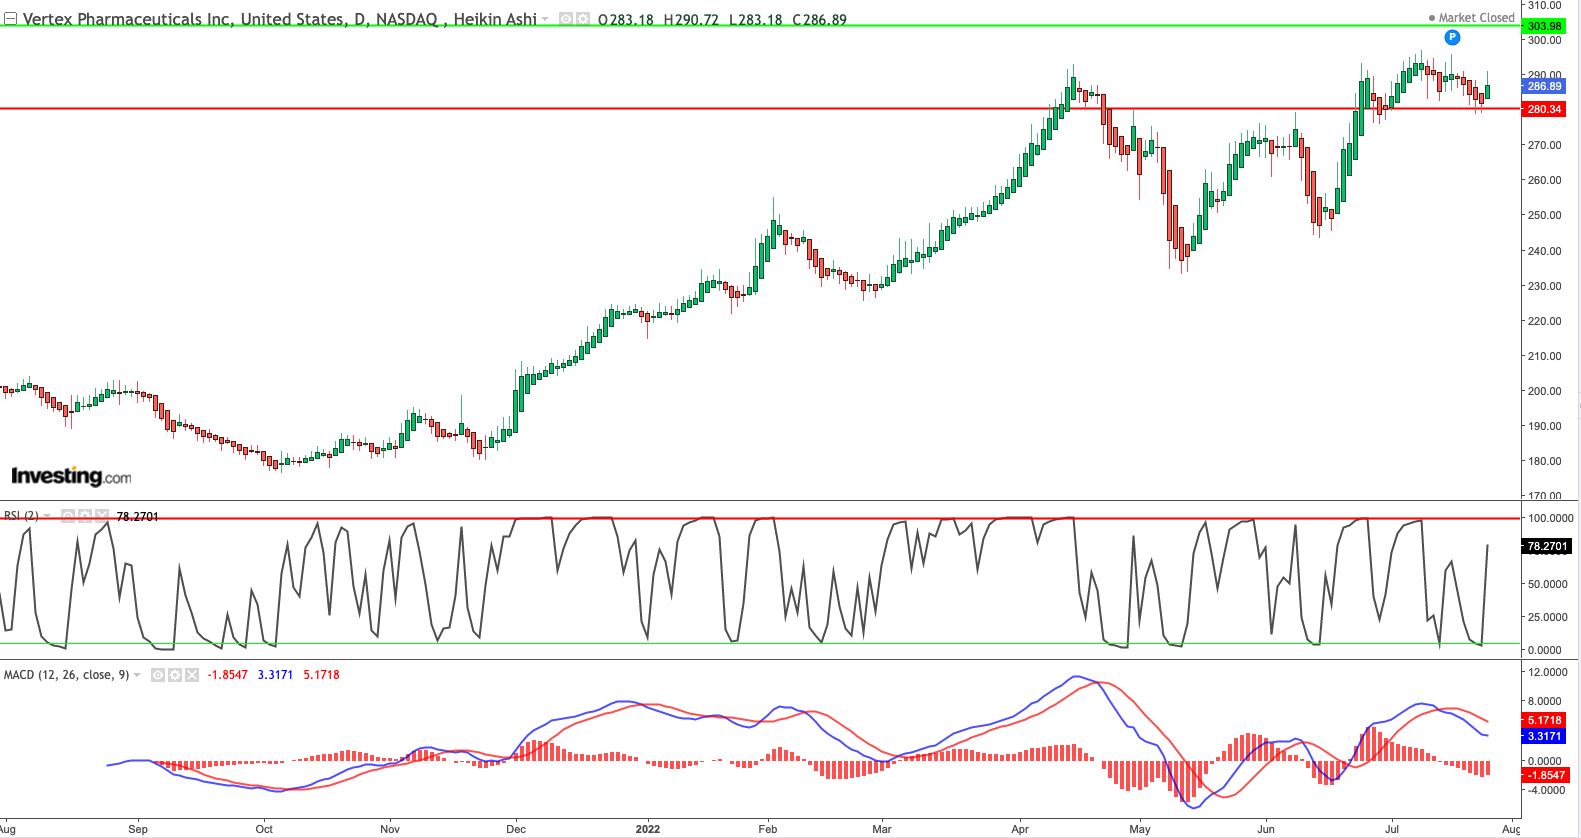
It is important to note that even though you are trading with the Heiken Ashi, you will need to take your Stop & Target price levels from the regular candlestick charts. You want to do this because, as mentioned earlier, the Heiken Ashi will show different closing prices and you will want to set your stops based on the actual market prices. Now let’s move on.
Based on the regular candlestick chart, the current price is 288.22. If we assume (just for the purposes of this exercise) that the entry price for the trade is also 288.22 then the stop loss will be:
Stop Loss = Entry Price – 1x ATR and
Profit Target = Entry Price + 2xATR
So we end up with a Stop loss = 280.34 and Profit Target at 303.98.
You can then simply set limit orders ( use OCO) that will trigger when either your stop or target is hit. Obviously, the target is the green line and the stop loss is the red one.

If you were taking a short position then you would obviously add the ATR to the entry price and subtract 2 x ATR from the entry price in order to get the target price. Like this:
Stop Loss (Short Position)= Entry Price + 1xATR and
Profit Target = Entry Price -2xATR
After you put your price levels in place, you can just switch back to the Heiken Ashi chart if you want to keep the “noise” to a minimum while you wait for your trade to play out.
Simple & Effective Trading Strategy
As you have seen, this is a simple and very effective strategy that has stood the test of time largely because it is rooted in how the market works both from a psychological ( traders chasing and then getting trapped at Overbought & Oversold levels) and mechanical ( order flow) perspective.
Test Out The Strategy For Yourself
Just like all other trading strategies, you will need to test it and see if it fits your personality, risk appetite , schedule etc. And once you settle on the strategy, you will have to practice so that you can become good at using it. That is the only way.
You only need to be good at one thing in this business. If you can become an expert/specialist with just one good setup/strategy, you will be able to make money for a very long time.
More Trading Strategies
If you found this tutorial useful, please feel free to share it so that others can get a hold of a strategy that actually works. You can also check out all the other Trading Strategies that are covered on this website.
Chris Corwin Gayle is a veteran trader and contributor to the Stocks & Futures Trading project.