ICT Draw On Liquidity
Draw On Liquidity (DOL) is a crucial concept in trading, it refers to how the market targets liquidity pools typically located at highs, lows and around key price levels. Understanding DOL helps traders anticipate price movements and make informed decisions.
This is the most important aspect of your analysis and should be your first priority when considering a trade.
Understanding the concept of Draw On Liquidity is crucial because it helps traders anticipate market moves by indentifying key price levels where liquidity pools such as swing highs and lows are located. These levels often act as magnets for price and recognizing them improves trade timing and risk management.
DOL also reveals where institutional traders might step in, allowing retail traders to align with smart money. Additionally, knowing where liquidity is drawn helps avoid common traps like stop hunts and avoid unnecessary losses.
The Types Of Draw On Liquidity (DOL)
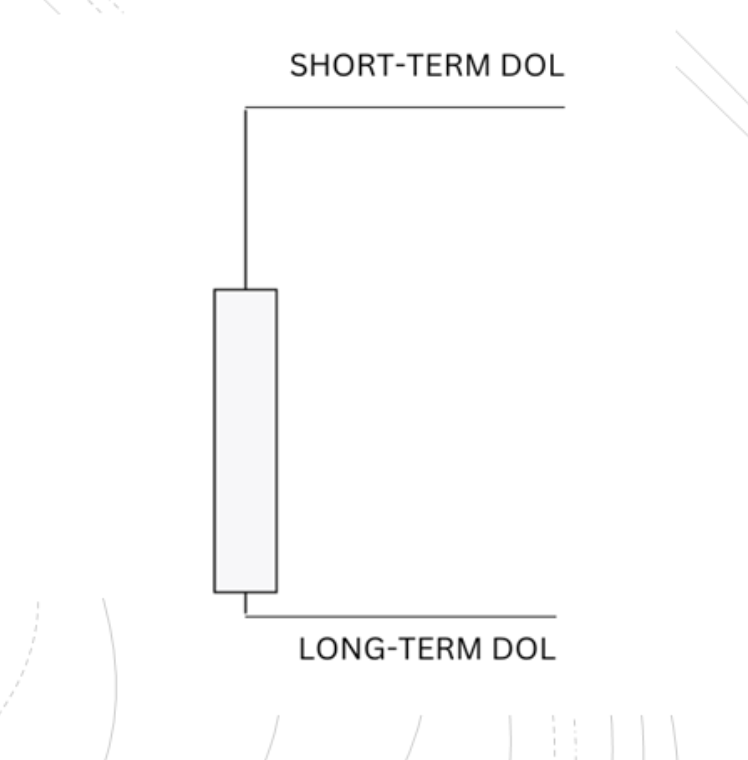
Short Term DOL
The short term draw on liquidity helps you identify where retracement profiles or shorter moves could end. It is used to determine where the market is initially drawn to in the immediate price action.
The long term draw on liquidity is about major moves and expansions. It helps you see where price is heading in the bigger picture, beyond immediate market reactions. This is used for understanding where price is likely to go as part of a broader narrative, guiding larger moves over higher timeframes, like daily, weekly or even monthly.
Order Flow & Draw On Liquidity
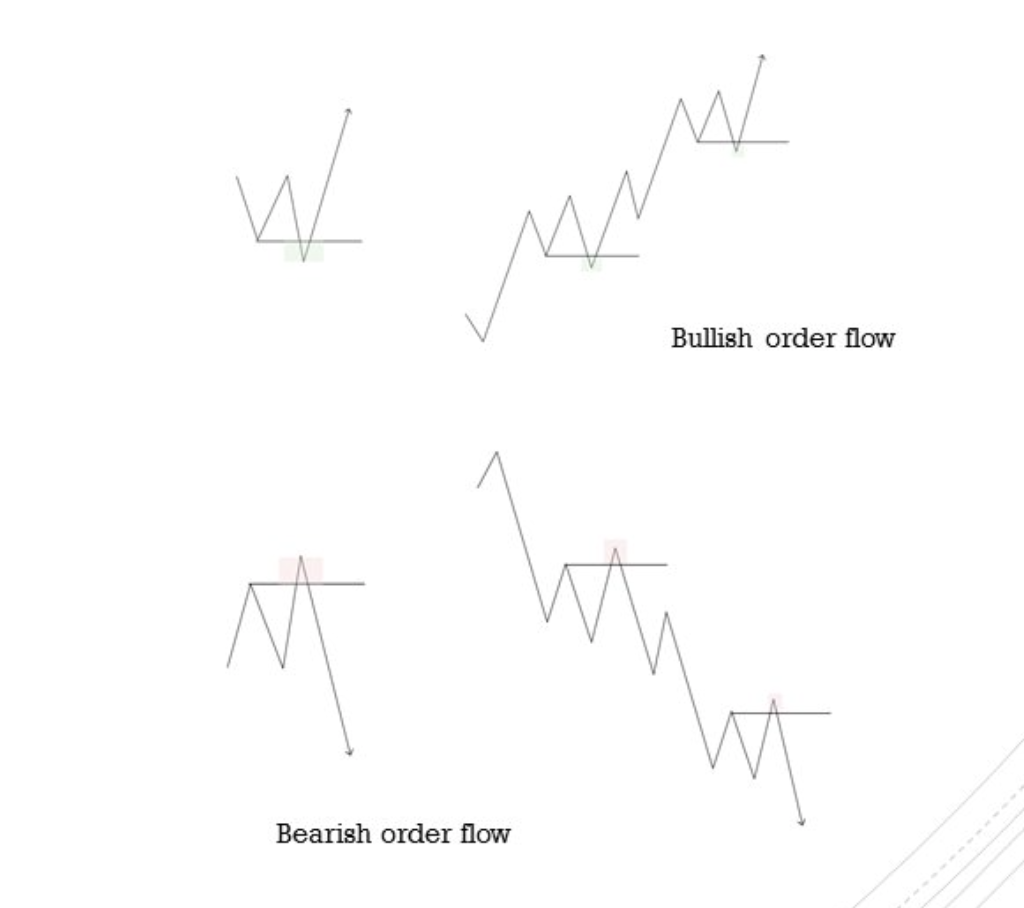
Order flow is a very important aspect in determining the DOL. In fact, if you can understand Order Flow it makes grasping, and using, the concept of DOL in your trading much easier. The most frequently occurrence of Order Flow influencing the DOL are when:
- Price continues to break above highs after getting rejected below the lows. This is known as Bullish order flow and
- Price continues breaking down below the lows and getting rejected above the highs which is known as bearish order flow.

Draw On Liquidity In The Form Of Candle Ranges
You can identify the Draw On Liquidity in the price action because it shows up in various ways:
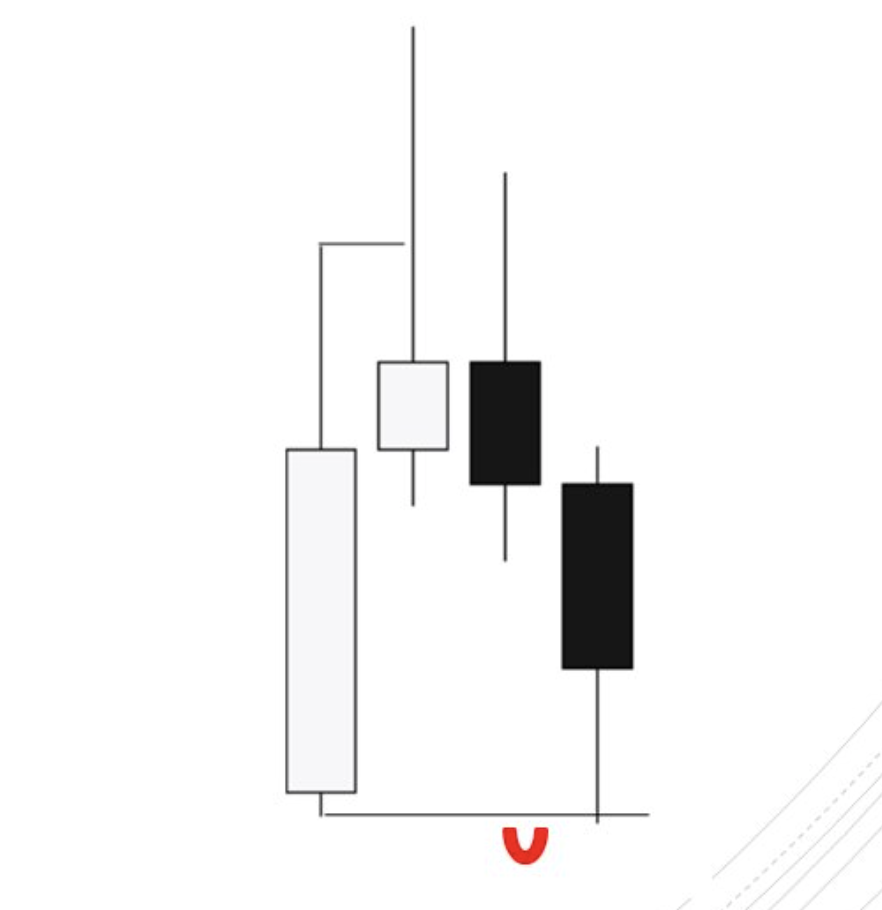
Candle Range High & Low
DOL in the form of CRT helps traders anticipate price movements more accurately, enabling them to take advantage of liquidity draws.
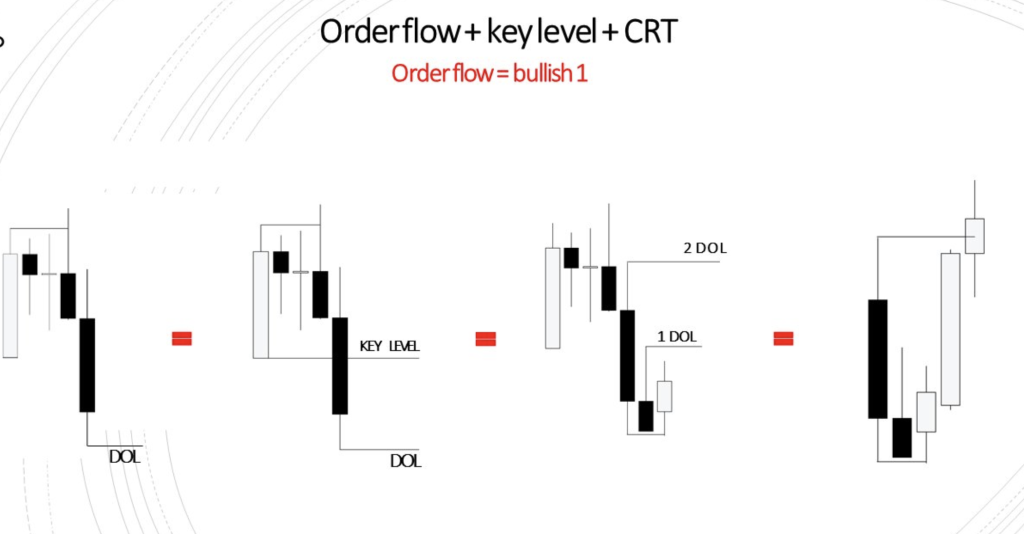
Order Flow & CRT Example
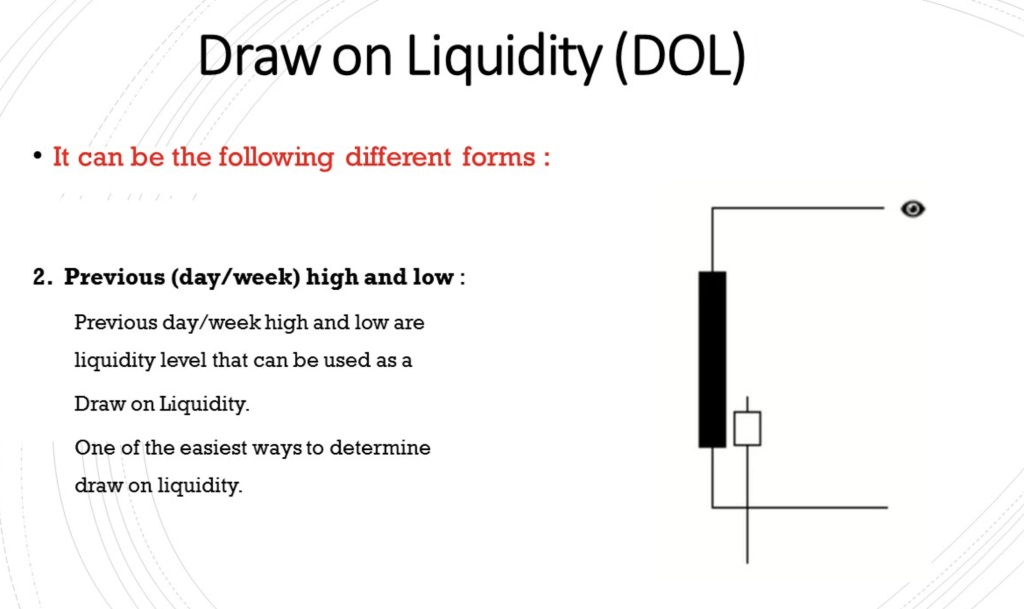
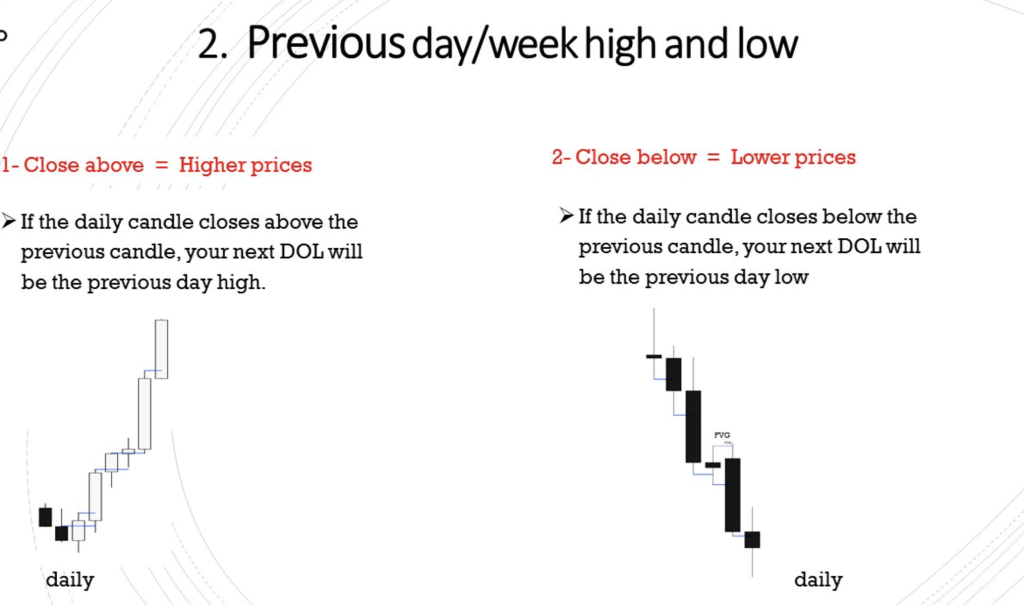
Previous Day/Week High & Low Draw On Liquidity Example
Mado, presented what can only be called a tour de force on the DOL and you can go more in depth here. You can also check out the full ICT Terminology list as well as features like ICT Liquidity Runs Explained, ICT Judas Swing Simplified, ICT Trading Range, ICT Market Maker Model Simplified, The ICT 9:30AM Open Manipulation, ICT FVG Fair Value Gap Meaning, ICT Asia Range, ICT AMD Meaning, The ICT Candle Counting Method and lots more.
Marian Safridis, Contributor , Stocks & Futures Trading Magazine
Comments are closed.