The ICT Candle Counting Method
Inner Circle Morpheus is an acolyte of the ICT Trading system and one of the most helpful traders in terms of sharing knowledge and experience. He took some time to roll back the curtain on the ICT Candle counting method and it is reposted here, in his words, for your benefit.
The Purpose of Counting Candles
The main purpose of counting candles is to anticipate shifts in the marketplace. Counting the candles is from the highest high and the lowest is another way of calibrating the IPDA Data Ranges of ICT. (Please kindly watch ICT’s videos about IPDA data ranges. The first 4 videos of ICT Month5 core content will help you a lot: https://t.co/UJHWhFsvuB)
ICT teaches counting backwards for look back purposes, to see what highs/lows we have in the past, before 20,40 and 60 trading days and determining them as open flout liquidity pools afterwards. This is the most brief explanation of ICT’s IPDA Data ranges.
1- ICT Determines the first trading day of the month.
2- He looks back 20-40-60 to determine the obvious market structure shift on the daily chart.
3- He casts forward by 20 days, If he finds out the obvious market shift, before up to 40 days ago. He does the same thing and casts forward by 40 days.
If he finds out the obvious market shift, before up to 20 days, because he says that the projection limit in time is 60 days maximum, so we separate this as 20-40 or 40-20 to make it complete to 60 trading days. Market does its quarterly shift in 60 to 80 trading days most of the time.
Yet, when we calibrate data ranges like this to anticipate next quarterly shift looks confusing for most of the people. That’s why IPDA data ranges of ICT is still underrated, but NWOG and NDOG is quite popular haha 😀
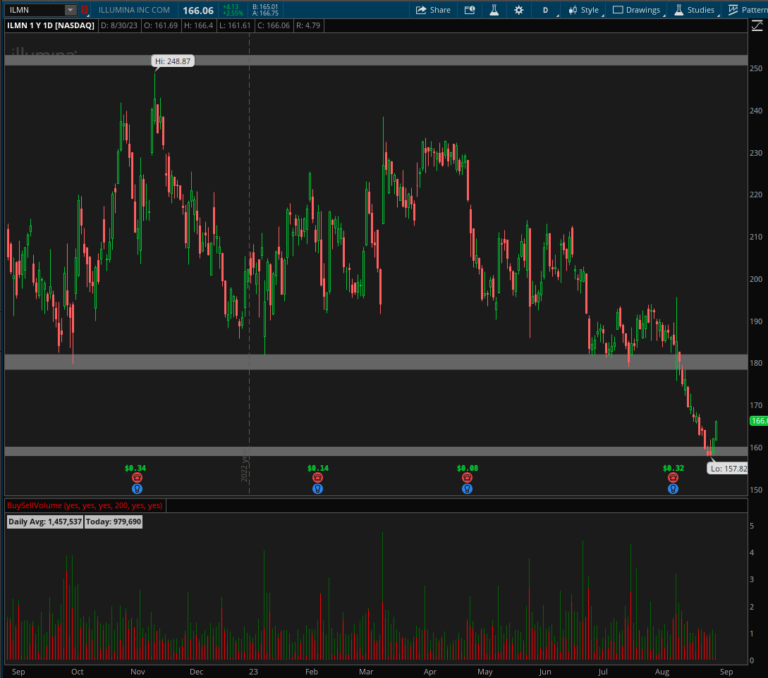
Trying To Catch The Highest High Or Lowest Low
It’s better to count the candles from highest highs and lowest lows, instead of looking back, finding the highest highs and lowest lows and then finding obvious market shift to calibrate IPDA data ranges once again.
There’s a reason why the bottom or top formed at specific time right there, so starting to count candles referencing that specific highs/lows will provide better results for us to anticipate next phases of the market. (Reversal,retracement, expansion etc.) This is the main reason why I count the candles, especially on monthly, weekly and daily chart.
Everything might become harder when the time is distorted and you might not get the reversal/retracement at 13th candle or 21st one. That’s normal and that happens when other macros in time axis are close to these numbers. Price deliveries begin properly, once all the macros are aligned properly at specific numbers, such as 7th week and 33rd day referencing the lowest low or the highest high.
Anticipating Market Shifts In Certain Times
We explained some very basics. Now i’m going to be talking about the set in stone rules of candle counting.
1- We always count from the highest highs and lowest lows.
2- If we’re counting with the bullish move to upside, we don’t count the down closed candles. We only count up closed candles.
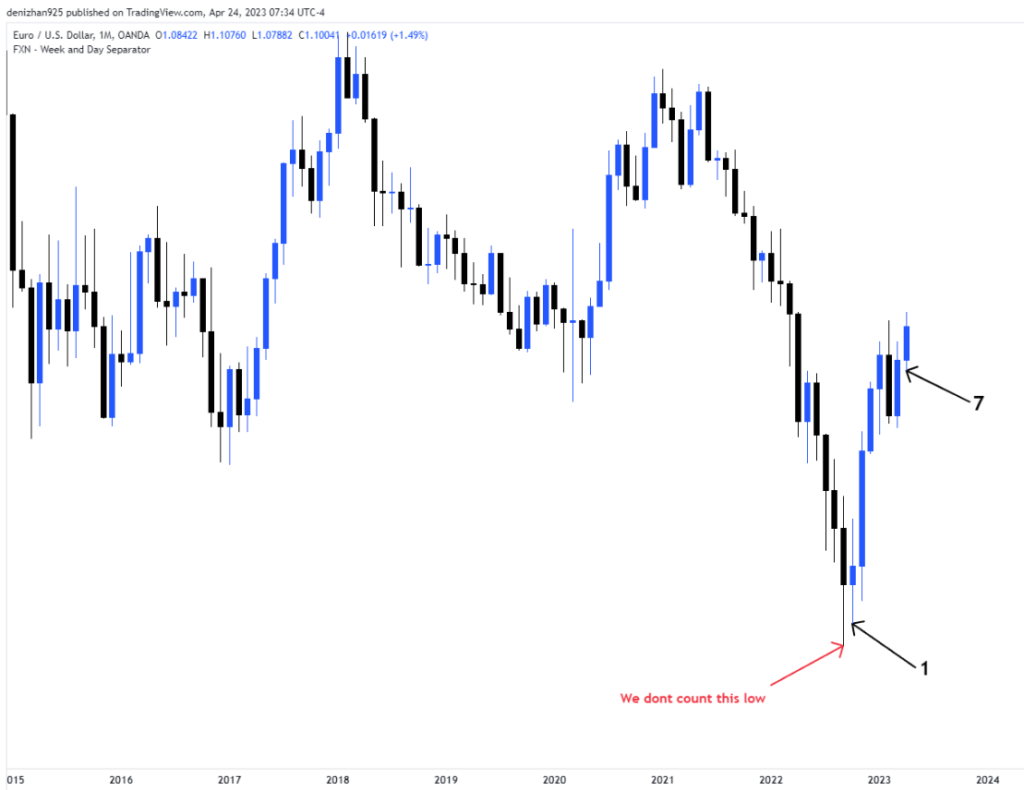
3- We try to ignore the consolidations and counting from the lowest low or highest highs, that leads to break the consolidation.
4- We never count “inside candles”(time-distorted candles). As you see the on tradingview chart below, candle “b” didn’t take out the high and the low of candle “a”, so we cann candle “b” is time distorted candle, but the candle “c” took out the low of candle “b”, so candle “c” is not time distorted candle.
Candle “d” didnt take out high/low of the candle “c”, so candle “d” is time distorted candle too. We never count these candle in time axis.
We explained the set in stone rules of candle counting. Now I’m going to be talking about the sequence in time axis.
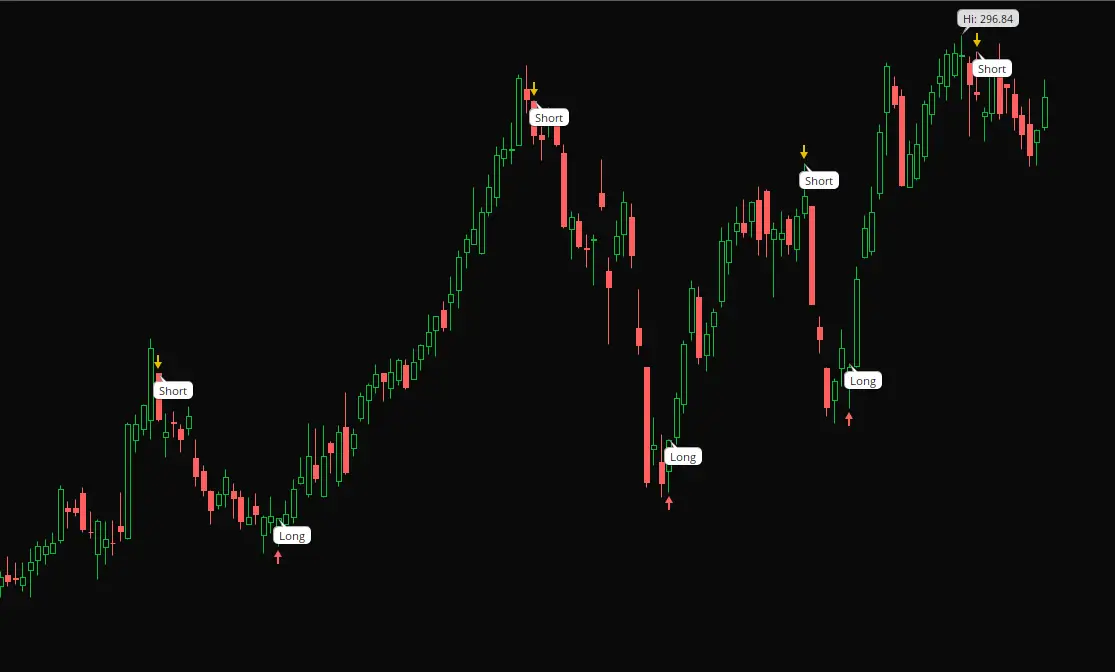
The sequence we often use is “7-13-21”, which is very close to fibonacci sequence and the multiples of these numbers are also essential. The magnitude of price moves significantly increases, as the price is close to multiplies of these numbers in time axis.
The characteristic of this sequence : We anticipate a retracement around 7th or 8th candle, depending on what correlated asset is also doing. 12th or 13th candle is crucial to anticipate intermediate term highs/lows or Reversals. 20th and 21st is when we anticipate long term highs/low are formed.
- 7th-8th is the best for FVG/OB Entries
- 12th-13th is the best for Turtle soups or FVG/OB entries
- 20th-21st is always the best for Turtle soups
- 33rd-34th is the best for FVG/OB Entries
- 40th-42nd is the best for Turtle soup, when the last shift of the market, up to 20 days before. Vice versa….
If you get obvious consolidations around these 7th,13th and 21st candles, then there’s something going on higher timeframes. Lower timeframe macros do this, when they try to align with higher timeframe sequences. This is how IPDA is coded. There’re lots of macros connected to each other, like a chain. As a human, we can only perceive a few of them and utilizing them in our trading.
Basically, what you should do is to check the candles on higher timeframes, once you get caught by time distortion (consolidations) on lower timeframes.
Always count candles from different timeframes to have the underlying narrative in price within PD Arrays. An Example :
Conclusion
I think it’s enough for now for the basics. Second thread about candle counting will be more advanced, where we count weekends and gathering all these things with the economic calendar to anticipate “The Day Of The Month”, “Day Of The Week”, “The Week Of the Month” and “The Hour of The Day”. Thanks for reading so far… Inner Circle Morpheus