Explanation Of The Inner Circle Trader (ICT) Terminology
If you have ever spent any time trying to learn or understand the ICT trading method then you will know that is full of terms and acronyms that can make it difficult to sift through and digest the info especially when all the acronyms are scribbled on a chart.
Below is a list of the acronyms and their meaning that can help you navigate the ICT material:
AMD: Accumulation, Manipulation, Distribution
BISI: Buyside Imbalance, Sellside Inefficiency
FTFC: Full Time Frame Continuity
IOFED: Institutional Order Flow Entry Drill
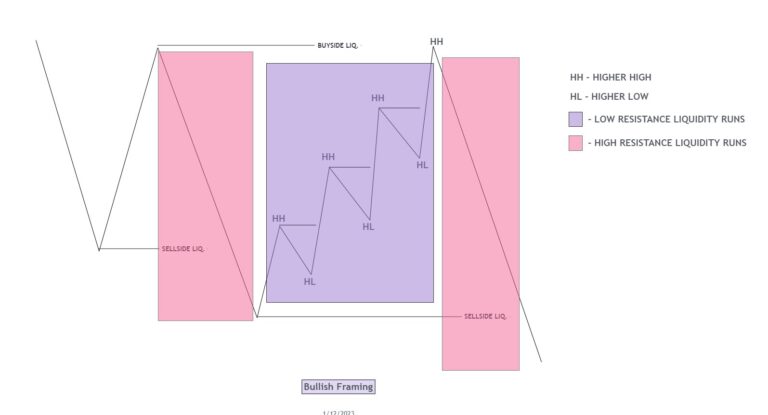
LRLR: Low Resistance Liquidity Run
AMD: Accumulation, Manipulation, Distribution
AMD refers to three phases or stages that are believed to occur in the price action of financial markets, particularly in forex trading.
Accumulation: The first phase, also known as the “smart money” or “whales” phase, is when large institutional traders, market makers, or smart money are believed to accumulate a particular asset at lower prices.
Manipulation: The second phase is the manipulation phase, where smart money is believed to intentionally manipulate the price to create a false impression of the market direction.
Distribution: The third phase is the distribution phase, where smart money is believed to distribute or offload their accumulated positions to retail traders or other market participants at higher prices.
AR: Asia Range
Asia Range refers to a specific time window during the Asian trading session where price tends to exhibit certain characteristics that traders may look to capitalize on. The Asia Range is typically the period of time during which the forex market is relatively quiet and lacks significant price movement, and it occurs during the Asian session, which is the time when financial markets in countries such as Japan, China, Australia, and New Zealand are most active.
BISI: Buyside Imbalance, Sellside Inefficiency
Buyside Imbalance refers to a situation where there is an excess of buy orders or buying pressure in the market, causing an imbalance between buying and selling forces. This can lead to a potential price imbalance, where the market may be biased towards upward price movement.
Sellside Inefficiency refers to a situation where there is a lack of effective selling pressure in the market, causing inefficiency in price movement. This can result in potential price imbalances where the market may be biased towards downward price movement.
BF: Broadening Formation
A Broadening Formation, also known as a Broadening Top or Megaphone pattern, is a price pattern that is characterized by price swings that widen over time. This pattern forms when a security’s price makes higher highs and lower lows, creating a broadening shape on the chart.
It typically indicates increased market volatility, indecision, or uncertainty among market participants.
BOS: Break of Structure
A Break of Structure occurs when the price of a security breaks through a previously established support or resistance level, violating the expected price behavior. For example, if a security’s price moves below a support level that was previously holding, it is considered a Break of Structure to the downside.
A Break of Structure is a potential indication of a shift in market dynamics, signaling a potential change in trend or momentum. It may suggest that the previous support or resistance level has been breached and that the balance of buying and selling pressure has shifted.
BSL: Buyside Liquidity
Buyside Liquidity refers to the volume of buying interest or buying pressure in a particular market or security. It is a concept that relates to the availability of buyers in the market and their willingness to execute buy orders at a given price level.
Buyside liquidity can help traders identify potential buying or selling zones in the market. For example, if a security is showing signs of increased buyside liquidity at a particular price level, it may suggest that there is a higher probability of prices moving higher from that level, as there are more buyers present in the market.
BPR: Balanced Price Range
Balanced Price Range refers to a price action pattern on a chart that shows equal buying and selling pressure, resulting in a balanced or equilibrium state in the market. It typically indicates a period of consolidation where neither buyers nor sellers have gained control, resulting in a relatively narrow price range.
CE: Consequent Encroachment
Consequent Encroachment refers to a price action pattern where price moves beyond a significant level of support or resistance after multiple tests of that level. It suggests that the buying or selling pressure has become stronger and has eventually breached the support or resistance level, potentially indicating a significant shift in market sentiment.
D: Discount
Discount refers to a price level or zone that is considered to be significantly lower than the current market price. It may also be referred to as a “discounted price” or “discounted level.”
DOL: Draw on Liquidity
Draw on Liquidity refers to the concept of identifying and taking advantage of areas in the market where liquidity is concentrated, typically at significant price levels or zones. See the full explanation & examples of Draw On Liquidity here.
EQ: Equilibrium
Equilibrium in the ICT method is often identified through price patterns, such as a range or consolidation pattern, where the price oscillates between clearly defined support and resistance levels. These price patterns can be seen on price charts as horizontal ranges, rectangles, or triangles, and they typically indicate a balance between supply and demand, where neither buyers nor sellers have a clear advantage.
EQH: Equal Highs
Equal Highs is where the price of an asset reaches the same level of resistance or peaks at the same level multiple times. It can be used as a technical signal to anticipate potential market movements. For example, if the price reaches Equal Highs and fails to break above that level, it may signal a potential reversal or a consolidation phase, indicating that selling pressure is strong at that level.
EQL: Equal lows
Equal lows occur when a security’s price reaches the same level of support multiple times, creating a horizontal line or a “floor” that holds up the price from further declining. It can indicate a potential turning point or a level of support where traders may consider entering long positions.
FTFC: Full Time Frame Continuity
Full Time Frame Continuity is a key concept within ICT, and it emphasizes the importance of analyzing price action, market structure, and key levels of support and resistance across multiple time frames, such as daily, weekly, and monthly charts, to confirm the validity of a trade setup.
FVG: Fair Value Gap
The Fair value Gap is an area where price has been inefficiently delivered and as a result there’s a gap or an imbalance that’s present on the chart. This is important because at some point the market or price will come back to that area and will either trade up into that area or price will completely correct that imbalance at some point in the future.
HH: Higher High
A term used in technical analysis to describe a pattern in which the highest price of an asset during a certain time period is higher than the highest price of the previous time period.
HL: Higher Low
A situation where the lowest price of an asset during a certain time period is higher than the lowest price of the previous time period.
In an uptrend, a series of consecutive higher lows and higher highs is often considered indicative of bullish momentum, suggesting that buyers are in control of the market. This can be used as a signal to enter a long trade or to stay in an existing long trade.
HOM: High of Month
The highest price traded on in a given month.
HOD: High of Day
The highest price traded on a given day.
HOW: High of Week
The highest price traded in a given week.
HTF: Higher Timeframe
A time frame that is higher than the current tike frame. For instance, the Weekly Chart is a higher time frame to the Daily Time frame.
IOFED: Institutional Order Flow Entry Drill
This is described as a partial entry into a fair value gap where there is also a Buyside Imabalance Sell Side Inefficiency. The fact that the price didn’t go all the way into the Fair valuer gap makes it an Institutional Order Flow Entry Drill.
LCKZ: London Close Kill Zone
This time period is typically defined as the last 30 minutes of the London trading session and the first 30 minutes of the New York trading session. During this time, the market tends to experience a significant increase in trading volume and volatility as traders in both London and New York overlap.
LO: London Open
The opening of the London market.
LOKZ: London Open Kill zone
During this time, the market tends to experience a significant increase in trading volume and volatility as traders in London and Europe enter the market.
LRLR: Low Resistance Liquidity Run
This occurs when price takes out a level where there was a previous failure swing.
LTF: Lower Timeframe
A time frame that is lower than the one before it. For instance the Daily time frame is lower than the Weekly time frame.
LH: Lower High
Price action where the highest point in a price movement is lower than the previous high. This pattern can be identified on a price chart by connecting the highest points with a trend line.
LL: Lower Low
Price action where the lowest point in a price movement is lower than the previous low. This pattern can be identified on a price chart by connecting the lowest points with a trend line.
MMBM: Market Maker Buy Model
The specific buying model that Market makers use to enter the market and create liquidity. This consists of 3 phases:
consist of three phases:
- The accumulation phase: Market makers will buy large quantities of an asset at lower prices to build up their position.
- The markup phase: Market makers will gradually raise the price of the asset to sell it to retail traders and other investors.
- The distribution phase: Market makers will sell their accumulated position to profit from the markup phase.
MMSM: Market Maker Sell Model
The selling model used by Market makers to exit the market and lock in profits. It consists of three phases:
- The distribution phase: Market makers will sell their accumulated position to profit from the markup phase.
- The markdown phase: Market makers will gradually lower the price of the asset to buy it back from retail traders and other investors.
- The accumulation phase: Market makers will buy back the asset at lower prices to build up their position.
MO: Midnight Open
The opening of the Asian trading session in the forex market. This occurs at midnight GMT (Greenwich Mean Time), which is the start of the trading day for countries such as Japan, China, and Australia.
MS: Market Structure
T a term used to describe the overall pattern of price movement in a particular market, including the highs, lows, and intermediate price swings.
Market structure is considered a key element of technical analysis in the inner circle trading method because it can provide valuable insights into the market’s overall direction and potential price movements.
MSS: Market Structure Shift
“Market Structure Shift” is a term used to describe a significant change in the overall pattern of price movement in a particular market. A market structure shift typically involves a shift in the prevailing trend or direction of the market, and can signal a potential change in market sentiment or fundamental conditions.
MSB: Market Structure Break
A significant change in the prevailing pattern of price movement in a particular market. Specifically, it is the point at which the market violates a key support or resistance level that had previously been holding the market in a particular pattern or trend.
NWOG: New Week Opening Gap
A gap that occurs on the price chart at the beginning of a new trading week. This gap is caused by a difference between the closing price of the previous week and the opening price of the current week, and it may be either positive or negative.
NDOG: New Day Opening Gap
“New Day Opening Gap” refers to a gap that occurs on the price chart at the beginning of a new trading day.
OTE: Optimal Trade Entry
“Optimal Trade Entry” refers to the best possible time and price at which to enter a trade based on the trader’s analysis of the market. The goal of identifying an optimal trade entry is to maximize the potential profit of the trade while minimizing the associated risk.
PDH: Previous Day’s High
The highest price traded in the previous session.
PDL: Previous Day’s Low
The lowest price traded in the previous session.
PMG: Pivot Machine Gun
The “Pivot Machine Gun” strategy involves looking for areas on the price chart where multiple pivot points converge, creating a “machine gun” pattern. This pattern may suggest a high degree of market volatility and potential trading opportunities.
PO3: Power of 3
“Power of 3” refers to a trading strategy that involves identifying and trading off three key levels on the price chart: support, resistance, and pivot points.
POI: Point of Interest
“Point of Interest” refers to a specific price level on the price chart that traders are watching for potential trading opportunities. A Point of Interest may be a key support or resistance level, a pivot point, or a price level where multiple technical analysis tools converge.
SIB: Sellside Imbalance
“Sellside Imbalance” refers to a situation where there are more sell orders than buy orders in the market, resulting in downward pressure on the price of the asset. This can occur due to a variety of reasons, such as a negative news announcement, a shift in market sentiment, or simply because of technical factors such as a break of a key support level.
SSL: Sellside Liquidity
“Sellside Liquidity” refers to the amount of sell orders available in the market at a particular price level. It represents the supply that sellers are willing to offer at a given price level.
VI: Volume Imbalance
“Volume Imbalance” refers to an excess of buying or selling activity in a particular market. It occurs when there is a large difference between the volume of buy orders and the volume of sell orders at a specific price level.
I hope this helps to de-mistify ICT for you.