Beat The Market With This Simple Market Profile Concept
A Market Profile is an intra-day charting technique (price vertical, time/activity horizontal) devised by J. Peter Steidlmayer, a trader at the Chicago Board of Trade (CBOT), ca 1959-1985. Steidlmayer was seeking a way to determine and to evaluate market value as it developed in the day time frame.
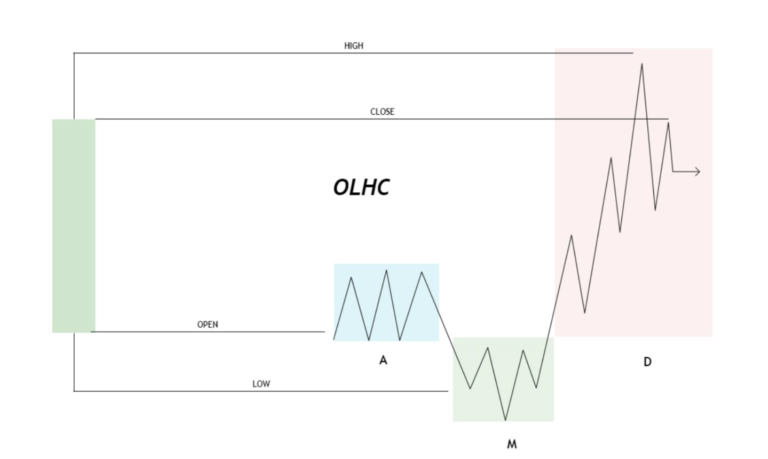
Market profile AKA TPO charts are essentially a 30 minute candle chart organized by using letter sequences that represent each 30 minute period. For example the RTH open would start with the letter A then 30 minutes later the letter B so on and so forth.
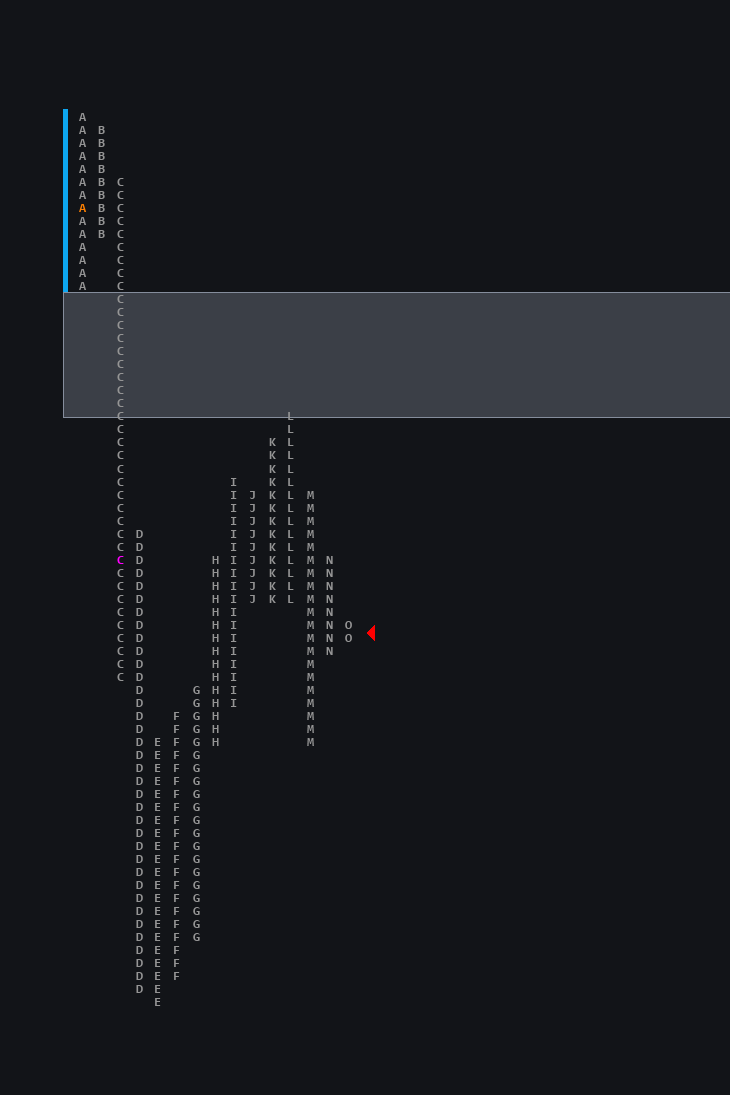
A single print is a period inside of the session where there is no overlap to prior periods. Here is an example:
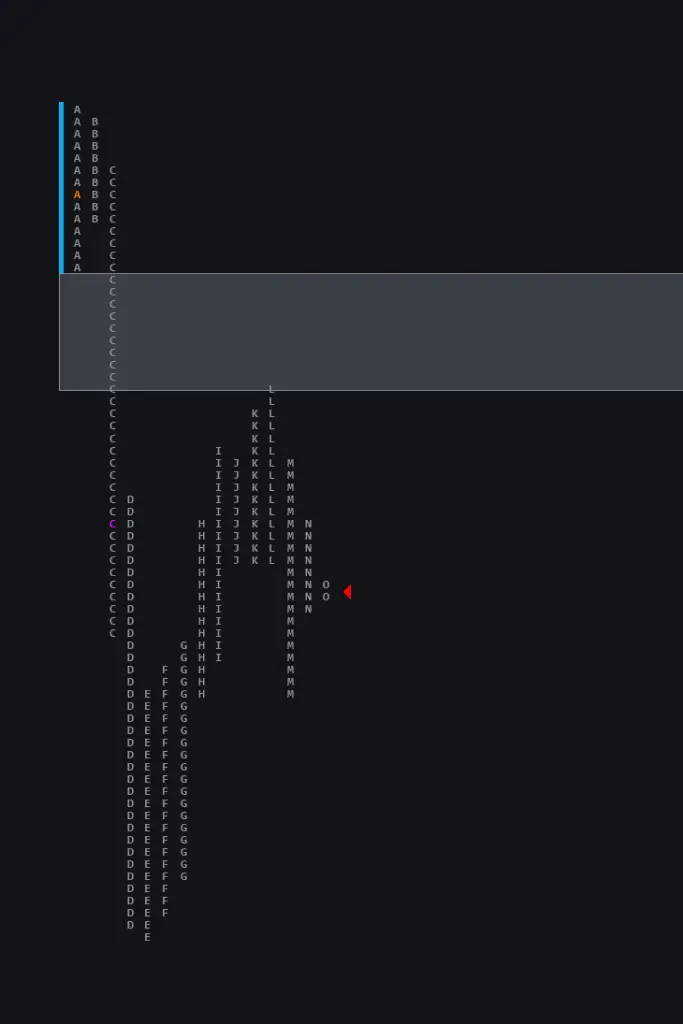
How To Understand & Trade Single Prints On The Market Profile
So what is it showing? In the simplest terms, an auction with single prints represents an incredibly strong auction from one side of participants. These participants are emotional, incredibly confident, or have no choice.
Well some of that is true but either way we don’t really care why or who is able to move the market in a single direction. What we DO care about is how to use this information to our advantage in a trading session.
Jim Dalton has said “the worst thing a trader can do is not believe a trend day” which is to say if the market is trading in a single direction you will get run over attempting to trade against the trend.
I would also argue that the default trading strategy for many retail traders is built on a mean reverting system and it makes sense because the adage “the market’s standard position is neutral/balance” is repeated by many books/literature and traders.
If the market is in balance more than it is in trend then the correct strategy would be more mean reverting. However by building a trading system around one method (mean reversion) while ignoring the other (trend) you will either get completely run over on trend activity or have no opportunity because you have no strategy when the market is trending.
Single prints are a clue that the market is attempting to trend, this is due to participants who actually move the market getting incredibly aggressive in one direction. Let’s look at some data points.
The Win Rate Of The Single Prints On The Market Profile
Out of the past 717 trading days, we had 376 days that had single prints; this equals 52% of days where the auction is attempting to go in a trend. Of the 376 SP days the trend held (defined as single prints held) 274 times, which means that 72% of the time when we have single prints the trend holds the direction of the single prints, the single prints are not traded through and we close in the direction of the trend. Pretty good argument by itself not to fight a trending day with single prints.
Taking it a step further, of the 376 Single Print days we have 102 Single Print failures which means the Single Print did not hold, this represents 27% of days with single prints. However, of those failures the original trend continued by the end of the session 43 times, this describes a day type where a trend was started, then failed and then ended up closing in the original direction of the trend.
Of the failed Single Print days there were 59 complete reversals, which is to say that the market attempted to auction in trend, the trend failed and the entire days range was traded through and closed in the opposite direction of the attempted trend. I boil this down a bit to say that only 15% (59 out of 376 days) of the time when a trend is attempted do we reverse the entire session and close in the opposite direction, which to me says that if I am going to fade a trend move I should expect to get punished the majority of the time. This is not putting things in my favor LOL.
In OFL my stated rule is that I do not fight a day with single prints. To take it a step further you may even use some of this data and exploit these moves by developing an approach that takes advantage of an auction so strong that it doesn’t make sense to fight it.
These data points are for NQ between April 2021 and Jan 2024 and are all my data points from visual inspection (yes I went through every single day and marked the details). Do your own homework. The number 1 takeaway for me and also surprising was the frequency of these conditions in which I assumed wasn’t very often to then realize this is something occurring 2.5 times per week on average.
Single Prints are a simple tool to help you gauge a market trend and the data says it happens more often than you likely think and makes little sense to fade these day types.
This feature is based on the work of Leo The Tiger a full time S&P500 Emini trader.If you liked this feature you can also get more useful trading info from Stockbee’s Trading Method, Blackrock’s Aladdin, A Tutorial On Market Structure, How To Trade With the BPSPX, The ICT Candle Counting Method, How To Pass A Trader Evaluation & Get Funded, The Top Step Trader Review, ICT Liquidity Runs, How To Trade The Options Chart & The Falang Futures Algo and How To Use Volume To Trade Like Banks & Institutions
Written by Silas Ferryman at Stocks & Futures Trading Magazine