Machine Learning For Trading: An Example Of A Simple Workflow
This is how you can use Machine Learning in Finance and trading.
In this feature you will see the step by step creation of a simple trend prediction on the SPY using a random forest.
This is the work of Danny Groves who goes by @DrDanobi on Twitter/X is a Trader & data Scientist who specializes in Data backed and algorithmic trading. I am presenting his brilliant work here for you unedited.
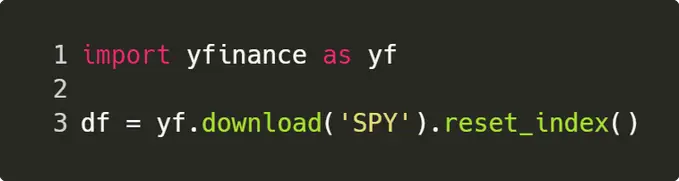
Step 1. Getting The Data
This is the easy part! Since we are looking at the daily time frame, we can use Yahoo finance to get the data in just two lines of code. The output will be a pandas data frame containing ~ 20 yrs of data.
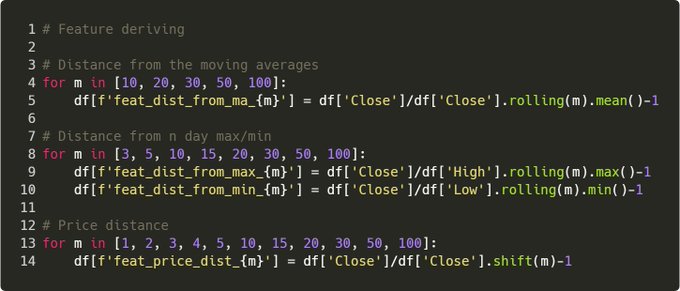
Step 2. Deriving The Features
The model needs something to learn from, so as a start, let’s give it:
• % change between the price and SMA
• % change from the price and rolling max/min
• % change in the price from n days ago Notice a pattern?
Step 2.5. Deriving the features
Yes, they’re all % The simple reason is that we want the model to learn general rules. If we feed it price, it may learn something like “oh this happened when SPY was $200”. % changes keep features generic over time scales.
Step 3. Target Variable
This is THE hardest bit IMO – if you give it crappy target, the model may not be able to learn anything! For the demo, let’s ask the model if it can predict if SPY will be above it’s 20SMA in 5 days time.
This could be one way of detecting trend reversals.
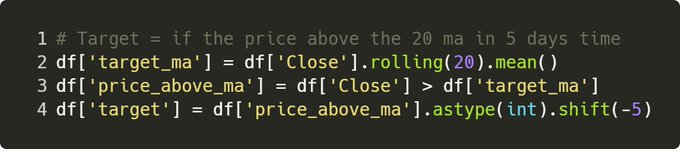
Now for my disclaimer, there is no secret sauce here – after all, this is a simple demo for you to try out. However this is definitely a better, more stable target than predicting prices in n days time.
Prices changes are messy, trends are smoother.
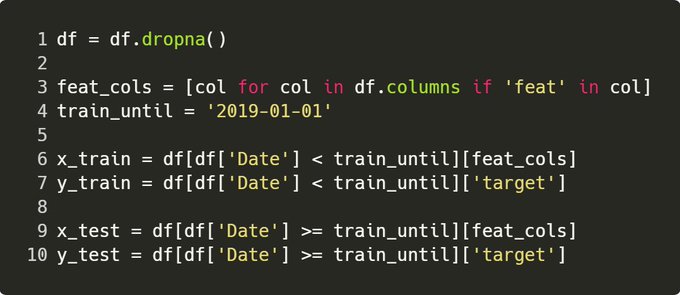
Step 4. Cleaning & Train/Test
Firstly, we need to clean rows with empty data – e.g. if we’re asking to predict 5 days in advance, the next 5 days haven’t happened yet, so no target to learn from.
The .dropna() sorts this out by eliminating rows where we can’t infer data.

For time series applications, it’s always better to split on a given date. This is the truest representation of how you’d use it live, and another way of avoiding some data leakage for training.
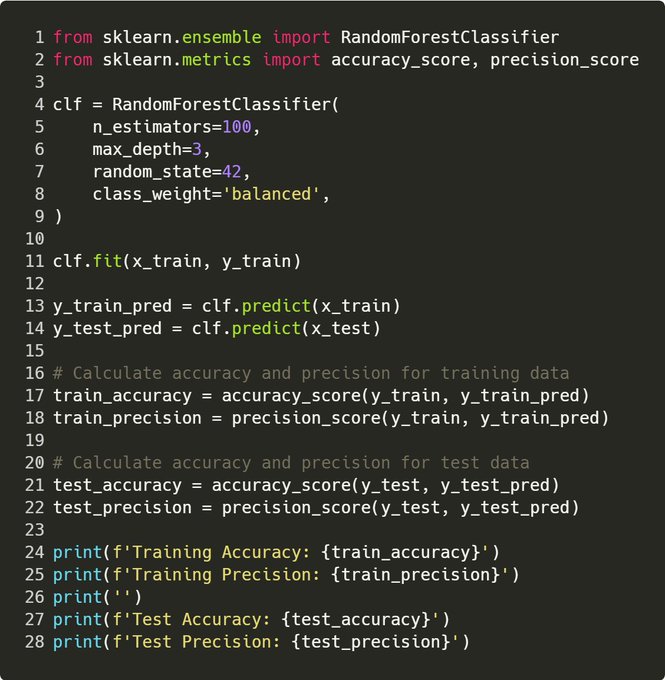
Step 5. Model Training
Honestly, this is the easy part. Some tips!
Tip 1: Keep max depth small Reason 1: This prevents overfitting, and forces the model to learn “general rules” from the data, rather than exact patterns
Sidebar: – max depth is how large a tree is. A random forest is essentially a collection of decision trees – max depth = 3 says that each of these trees can’t be greater than 3 deep.
More depth = the model can learn more intricate patterns -> it may be too intricate and overfit!
Tip 2: Use a random state Reason 2: This allows consistent results between runs, so you can properly test any improvements. E.g. if we re-ran this code, it would give the exact same output. Why 42? Because it’s the answer to the universe, and everything!

Tip 3: Evaluate over the train & test Reason 3: If the performance of your model looks amazing over train and crap over test, it’s overfitted.
I aim to achieve similar performance over both sets. E.g. for this, accuracy ~ 70% over both, precision ~ 80%

Tip 4: Use precision! Reason 4: Precision is the proportion of true positive predictions out of all positive predictions made by a classifier. Basically, a % of how many times the model was right when it said “IT’S GO TIME!”.
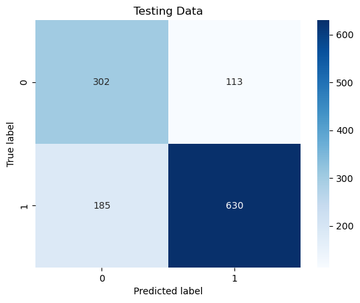
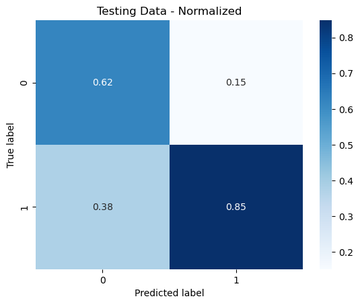
Step 6. Confusion Matrix
This shows you concretely how many times the classifier was right/wrong in both classes. You want to see a strong diagonal matrix.
Tip: Plot with raw figures and normalized Reason: Normalized is easier digest, raw shows you the sample size used
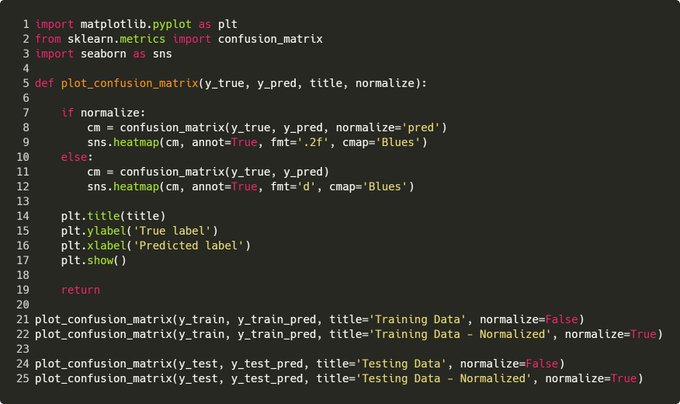
For those interested, here was the test set. It’s a good idea to plot everything over both train/test – so you have a visual comparison of how well the model generalized.
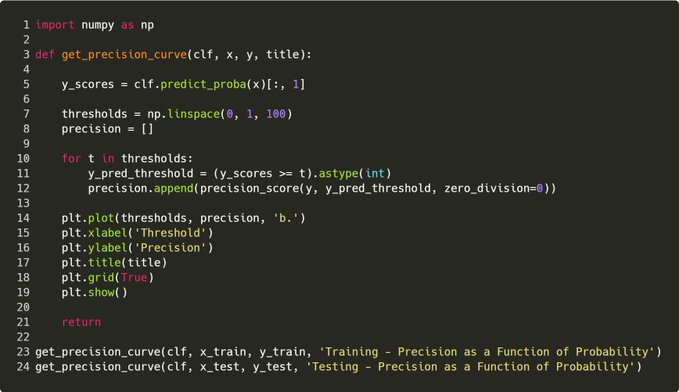
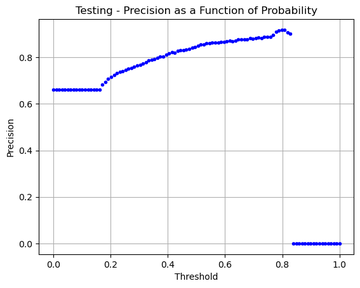
Step 7. Precision Curve
I also like to see how the precision increases as the model probability increases. Ideally, you want to see this trending up, and it gives a good idea of the sort of threshold that may be useful to use for a desired precision.
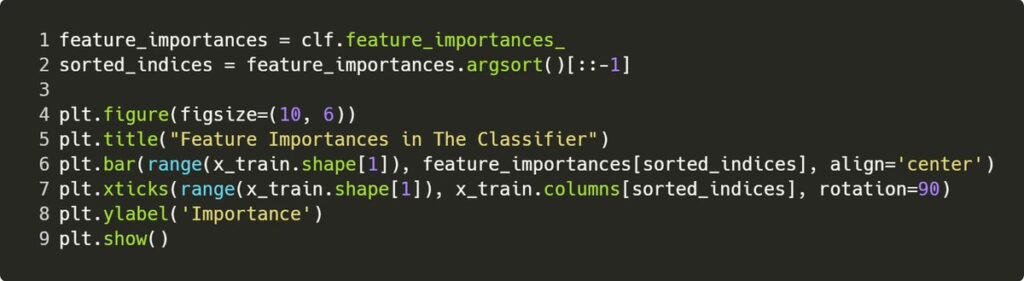
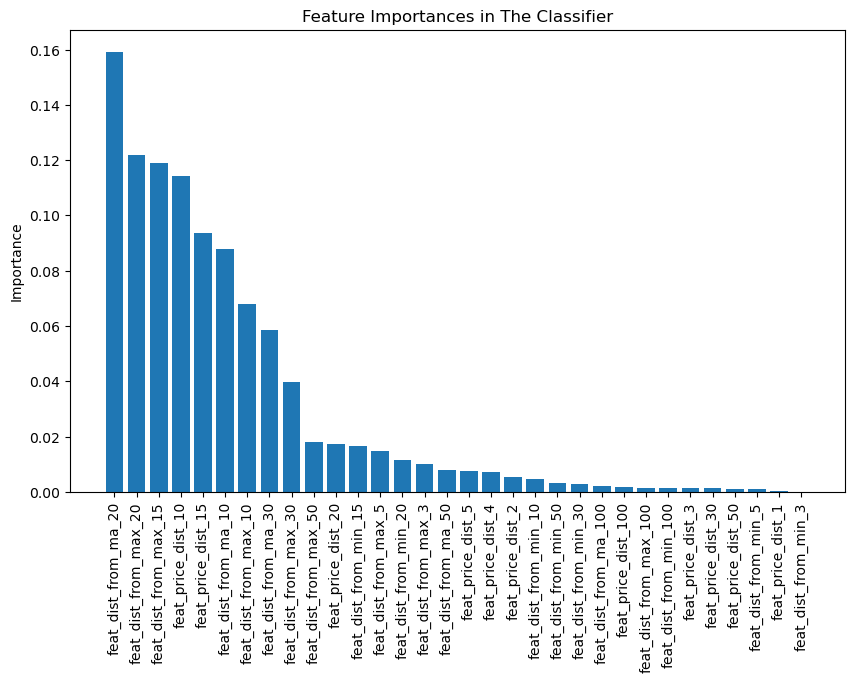
Step 8. Feature Importance
Now you got some confidence in the model, check feature importance! Reason: you may want to feature engineer some more and get better results E.g. the quick signal I get is I may want to look into engineering around the rolling max feature.
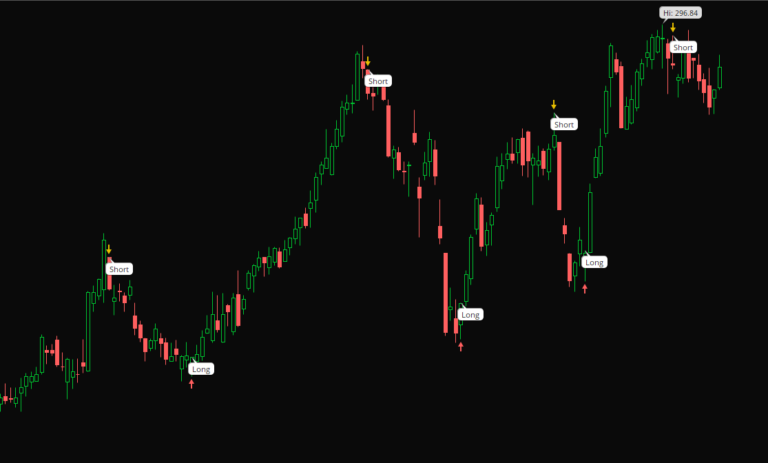
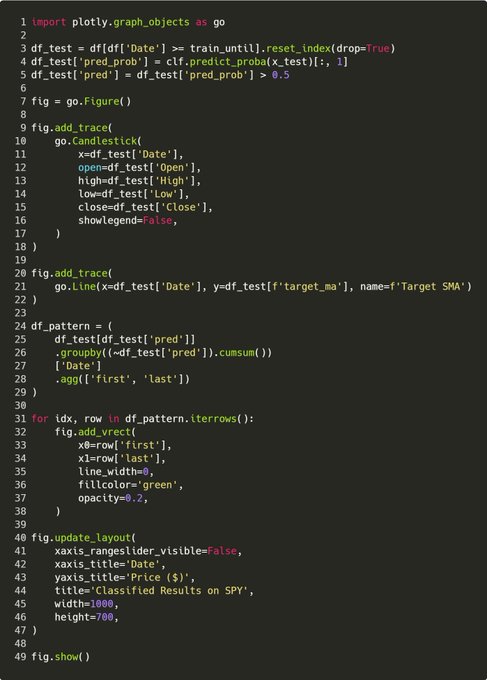
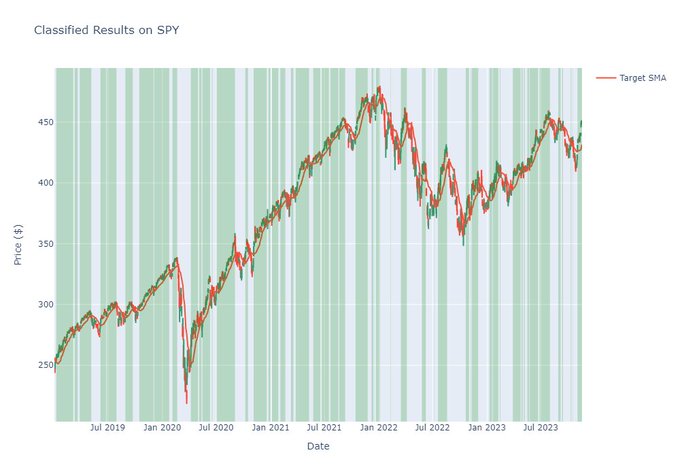
Step 9. Visualize On A Chart
This is essential for time series classifiers & gives you another way of evaluating model success. E.g. there are some hiccups in sideways areas – this says maybe better features or a more defined target is require to avoid the chop!
And there we have it! An end-to-end example of a simple machine learning workflow. Honestly, this is super simple and there is tons more to cover, e.g:
• Hyperparameter optimisation
• AUC/ROC
• Feature Engineering
• Target Improvements
• Different models And so much more!